Combine Keltner and Bollinger using different symbols for each


Category:
0
0

Hi,

How would I compose a simple lower study that involves 2 symbols with 2 different studies?

For example, I want a plot when current symbol, Symbol A,  close is higher than 1.5 of its KeltnerChannels and another symbol’s, Symbol B, close is higher than its upper BollingerBands.

I figured out I can use close(“GOOG”) to get price. How do I perform a similar task if want GOOG’s BollingerBand

.

Marked as spam
Posted by (Questions: 3, Answers: 3)
Asked on June 14, 2019 6:26 pm
119 views
0

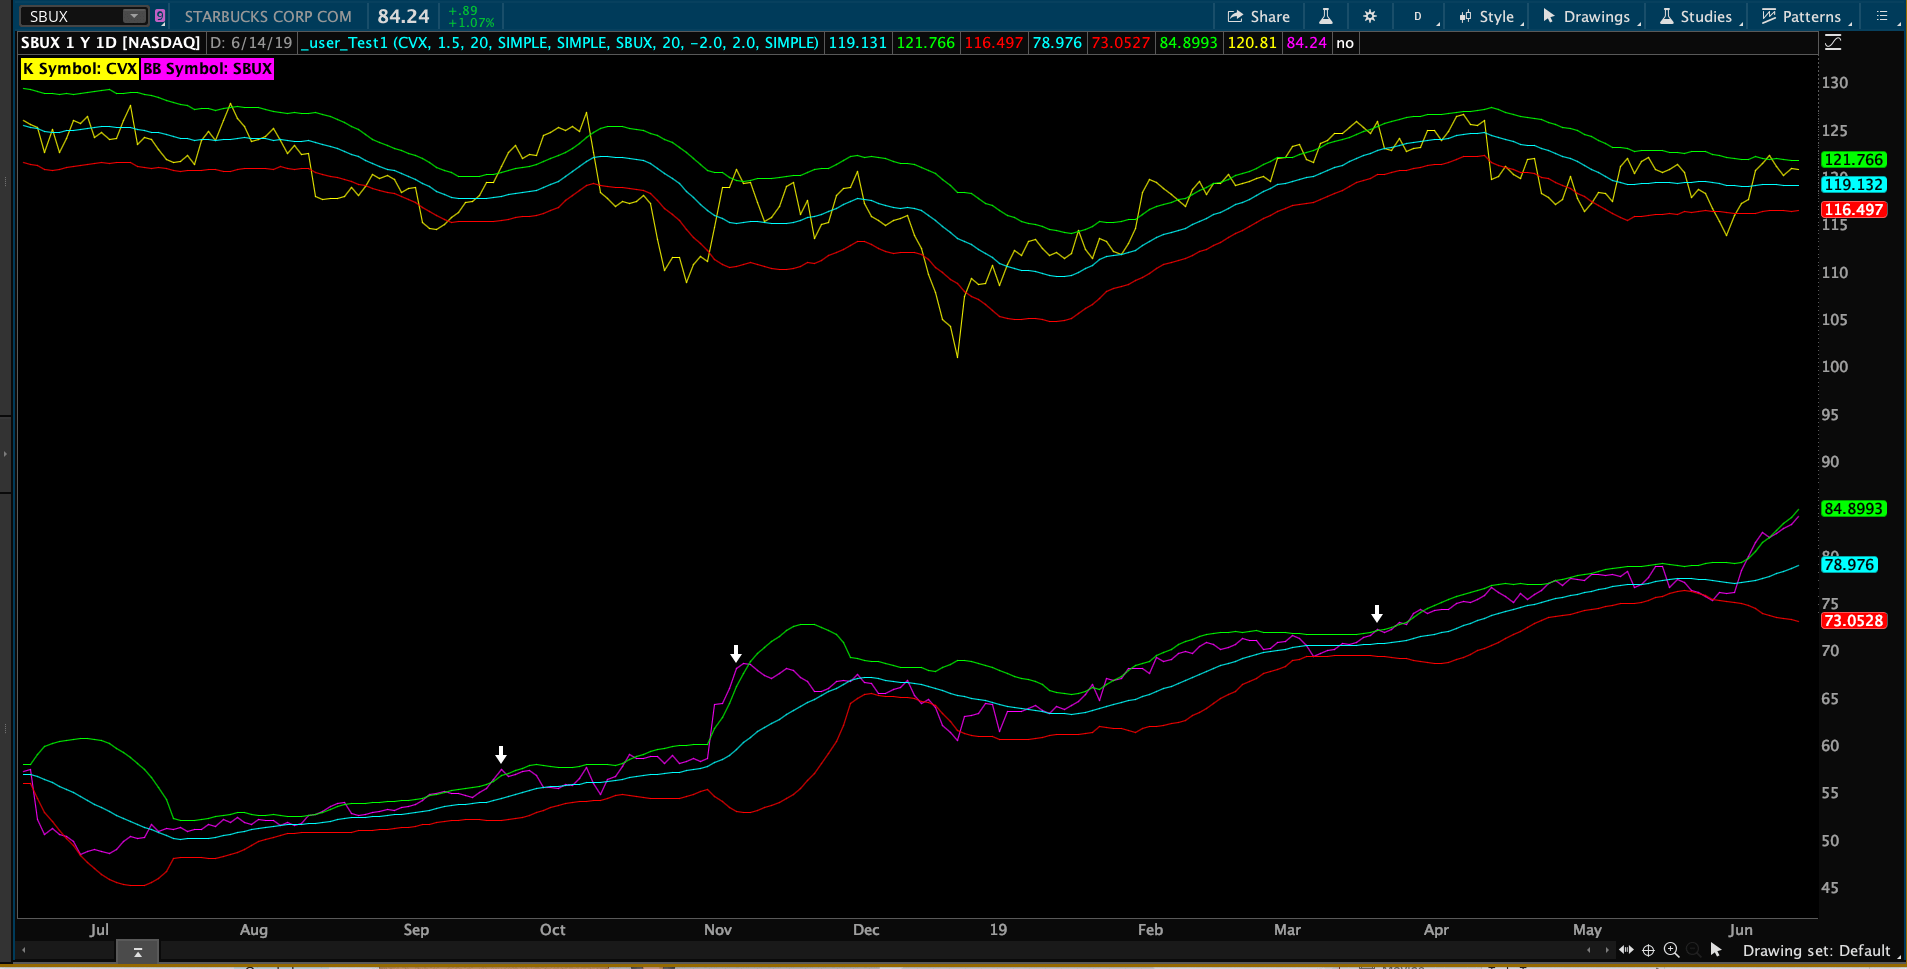
You question is about a chart study. So I have moved this out of the "Frequently Asked Questions" topic and into the "Chart Studies" topic.

I have changed the title of the question to better reflect the context of your question. This makes it easier for other viewers who are seeking a similar solution to search for and find this post.

Your original question title was "Referencing Other Data in TOS". The new question title is "Combine Keltner and Bollinger using different symbols for each"

Now on to your question. I need you to clarify this statement:

"Symbol A, close is higher than 1.5 of its KeltnerChannels"

It would seem that you are actually referring to the close of the bar being higher than the upper band of the Keltner Channel multiplied by 1.5. There are three plots in the Keltner channel study. Please be specific in your request.

( at June 15, 2019 8:17 am)
0
Hi Pete, I appreciate your response. In this example, I am referring to the upper band of of KeltnerChannels in TOS. In the study, I can specify the length, average type, true range average type. Have I provided what you looking for?
( at June 16, 2019 9:51 am)
0
Private answer

Well I must admit this is a pretty odd request. But that's just my opinion. I have no clue if there is any value to this. Except for the amount of time I put into it. Turns out this code is a bit more complex than what I typically publish for no charge. In fact I have done a bunch of custom projects for solutions that are much less complex than this. So in fairness to my other clients I really can't share the code for this in a public forum.

However, just in case you or someone else finds this valuable enough to pay for I am providing a screenshot showing what the end product looks like. Ordinarily I would just recommend you submit this as a custom project request and not provide any details at all. So please consider this screenshot as a bonus and not as a tease.

Attachments:
Marked as spam
Posted by (Questions: 37, Answers: 4084)
Answered on June 16, 2019 3:35 pm
0
Hi Pete, I appreciate you provide an answer. It is probably my fault that I may not explain clearly the intent. Here is another try: How would I compose a simple lower study that involves 2 symbols with 2 different studies? Condition 1: Symbol A, close is higher than 1.5 of its KeltnerChannels. Condition 2: Symbo B, close is higher than its upper BollingerBands. Plot when the 2 condition is met in a lower study when I display symbol A. I just want to see the conditon is meet. Assuming symbol B is GOOG. I figured out I can use close(“GOOG”) to get price. How do I perform a similar task if want GOOG’s BollingerBand Does my input help to clarify what I desire? Thank you for your time and input.
( at June 17, 2019 9:14 am)
0

Actually what you see in that screenshot is exactly that. Those white arrows are what you would see in the lower study of the indicator you are asking for. The reason you see all the other plots on the chart is to demonstrate those white arrows are appearing exactly where you have requested those signals to be generated.

The solution to your question is not simple at all. It requires that you modify the existing code for Keltner and Bollinger band to read data from those other ticker symbols instead of the ticker symbol plotted on the chart.

( at June 17, 2019 4:28 pm)