I have a IV/HV tool I use and curious how to create a scan using this. I would like to know when the HV is above the 80% level on a daily chart. Red line is above the top white line. Find stocks that meet that criteria.
Here is the tools code:
declare lower;
plot IV = ImpVolatility() ;
plot HV = HistoricalVolatility(30) ;
plot HVAnnualHigh = Highest(HV, 252) ;
plot HVAnnualLow = Lowest(HV, 252) ;
plot Level80Pct = HVAnnualLow + (((HVAnnualHigh – HVAnnualLow) / 5) * 4) ;
plot Level60Pct = HVAnnualLow + (((HVAnnualHigh – HVAnnualLow) / 5) * 3) ;
plot Level40Pct = HVAnnualLow + (((HVAnnualHigh – HVAnnualLow) / 5) * 2) ;
plot Level20Pct = HVAnnualLow + ((HVAnnualHigh – HVAnnualLow) / 5) ;
IV.SetDefaultColor(Color.RED);
HV.SetDefaultColor(Color.BLUE);
HVAnnualHigh.SetDefaultColor(Color.BLACK);
Level80Pct.SetDefaultColor(Color.white);
Level60Pct.SetDefaultColor(Color.white);
Level40Pct.SetDefaultColor(Color.white);
Level20Pct.SetDefaultColor(Color.white);
HVAnnualLow.SetDefaultColor(Color.black);
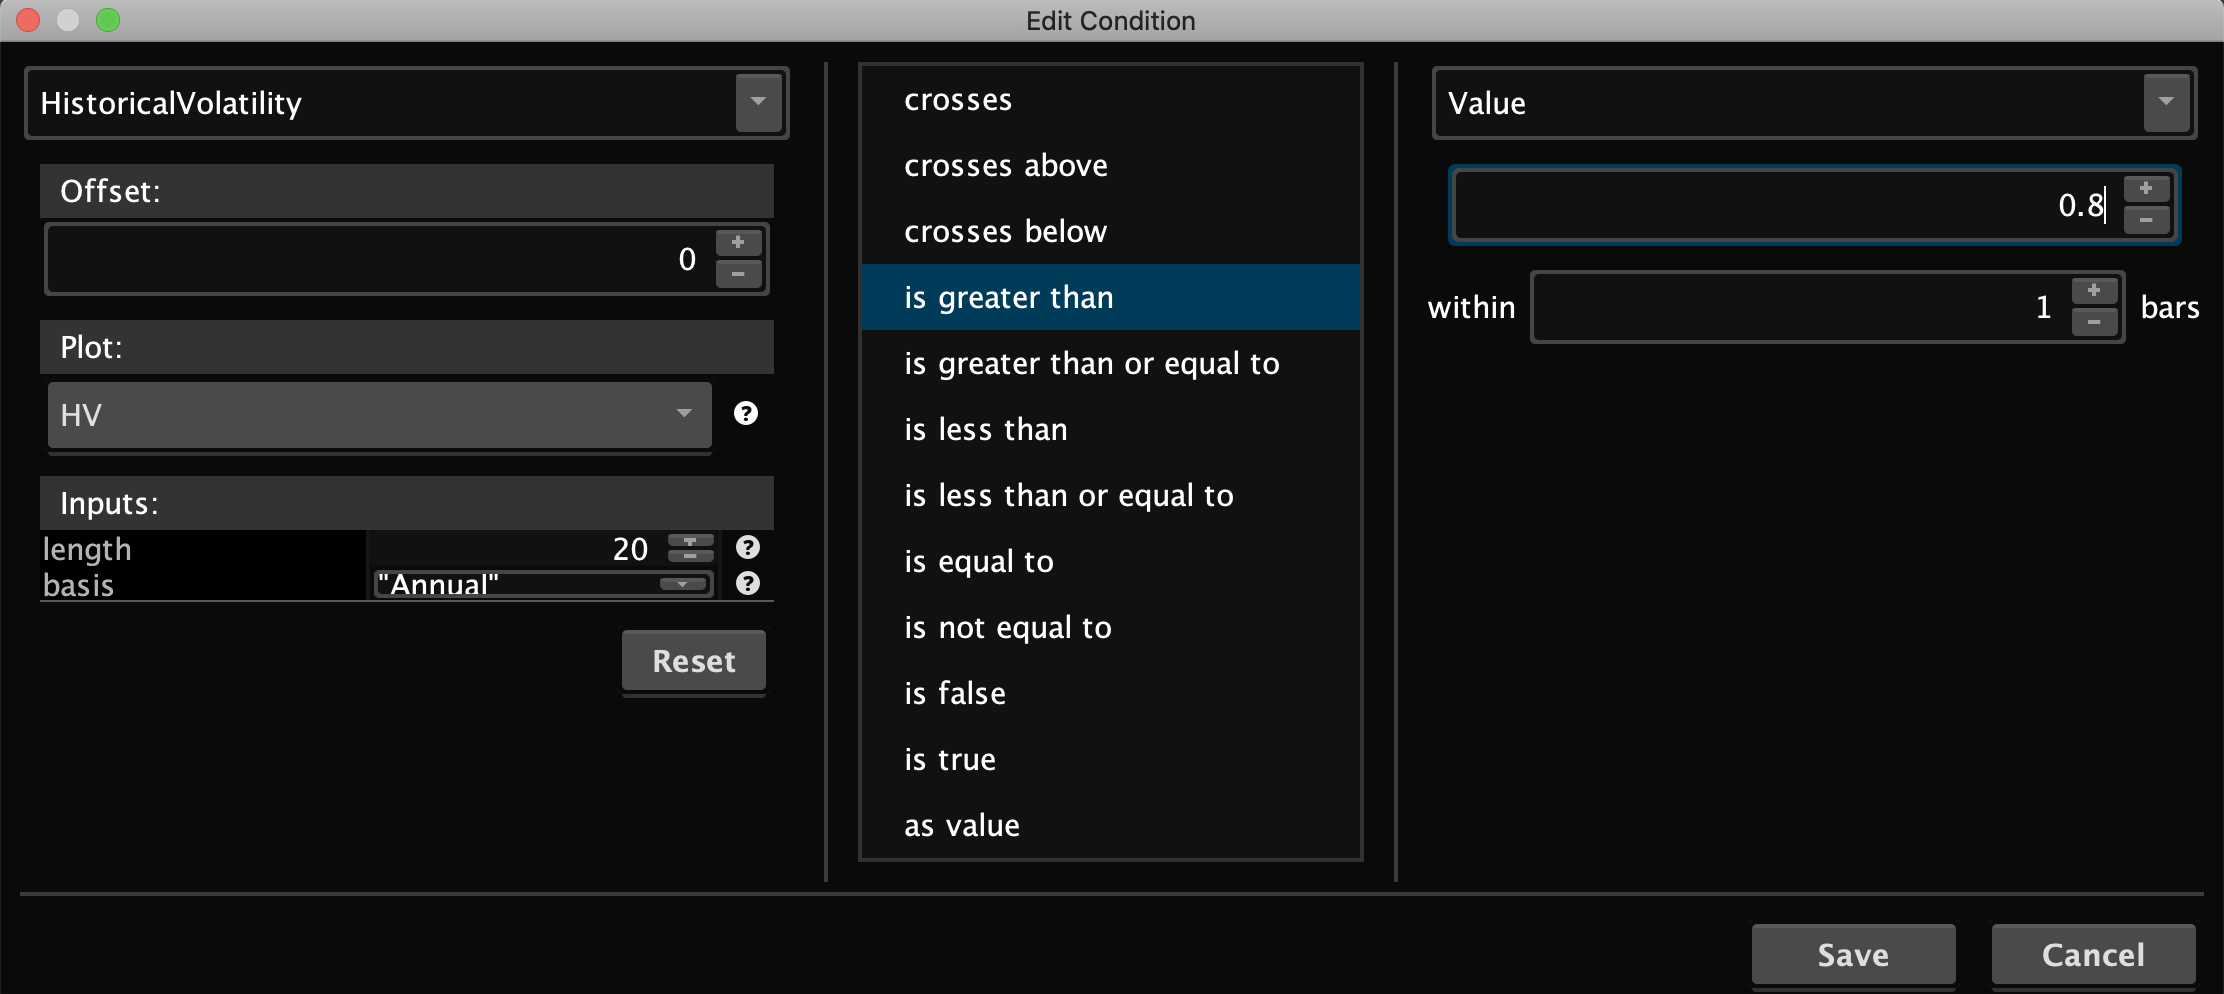
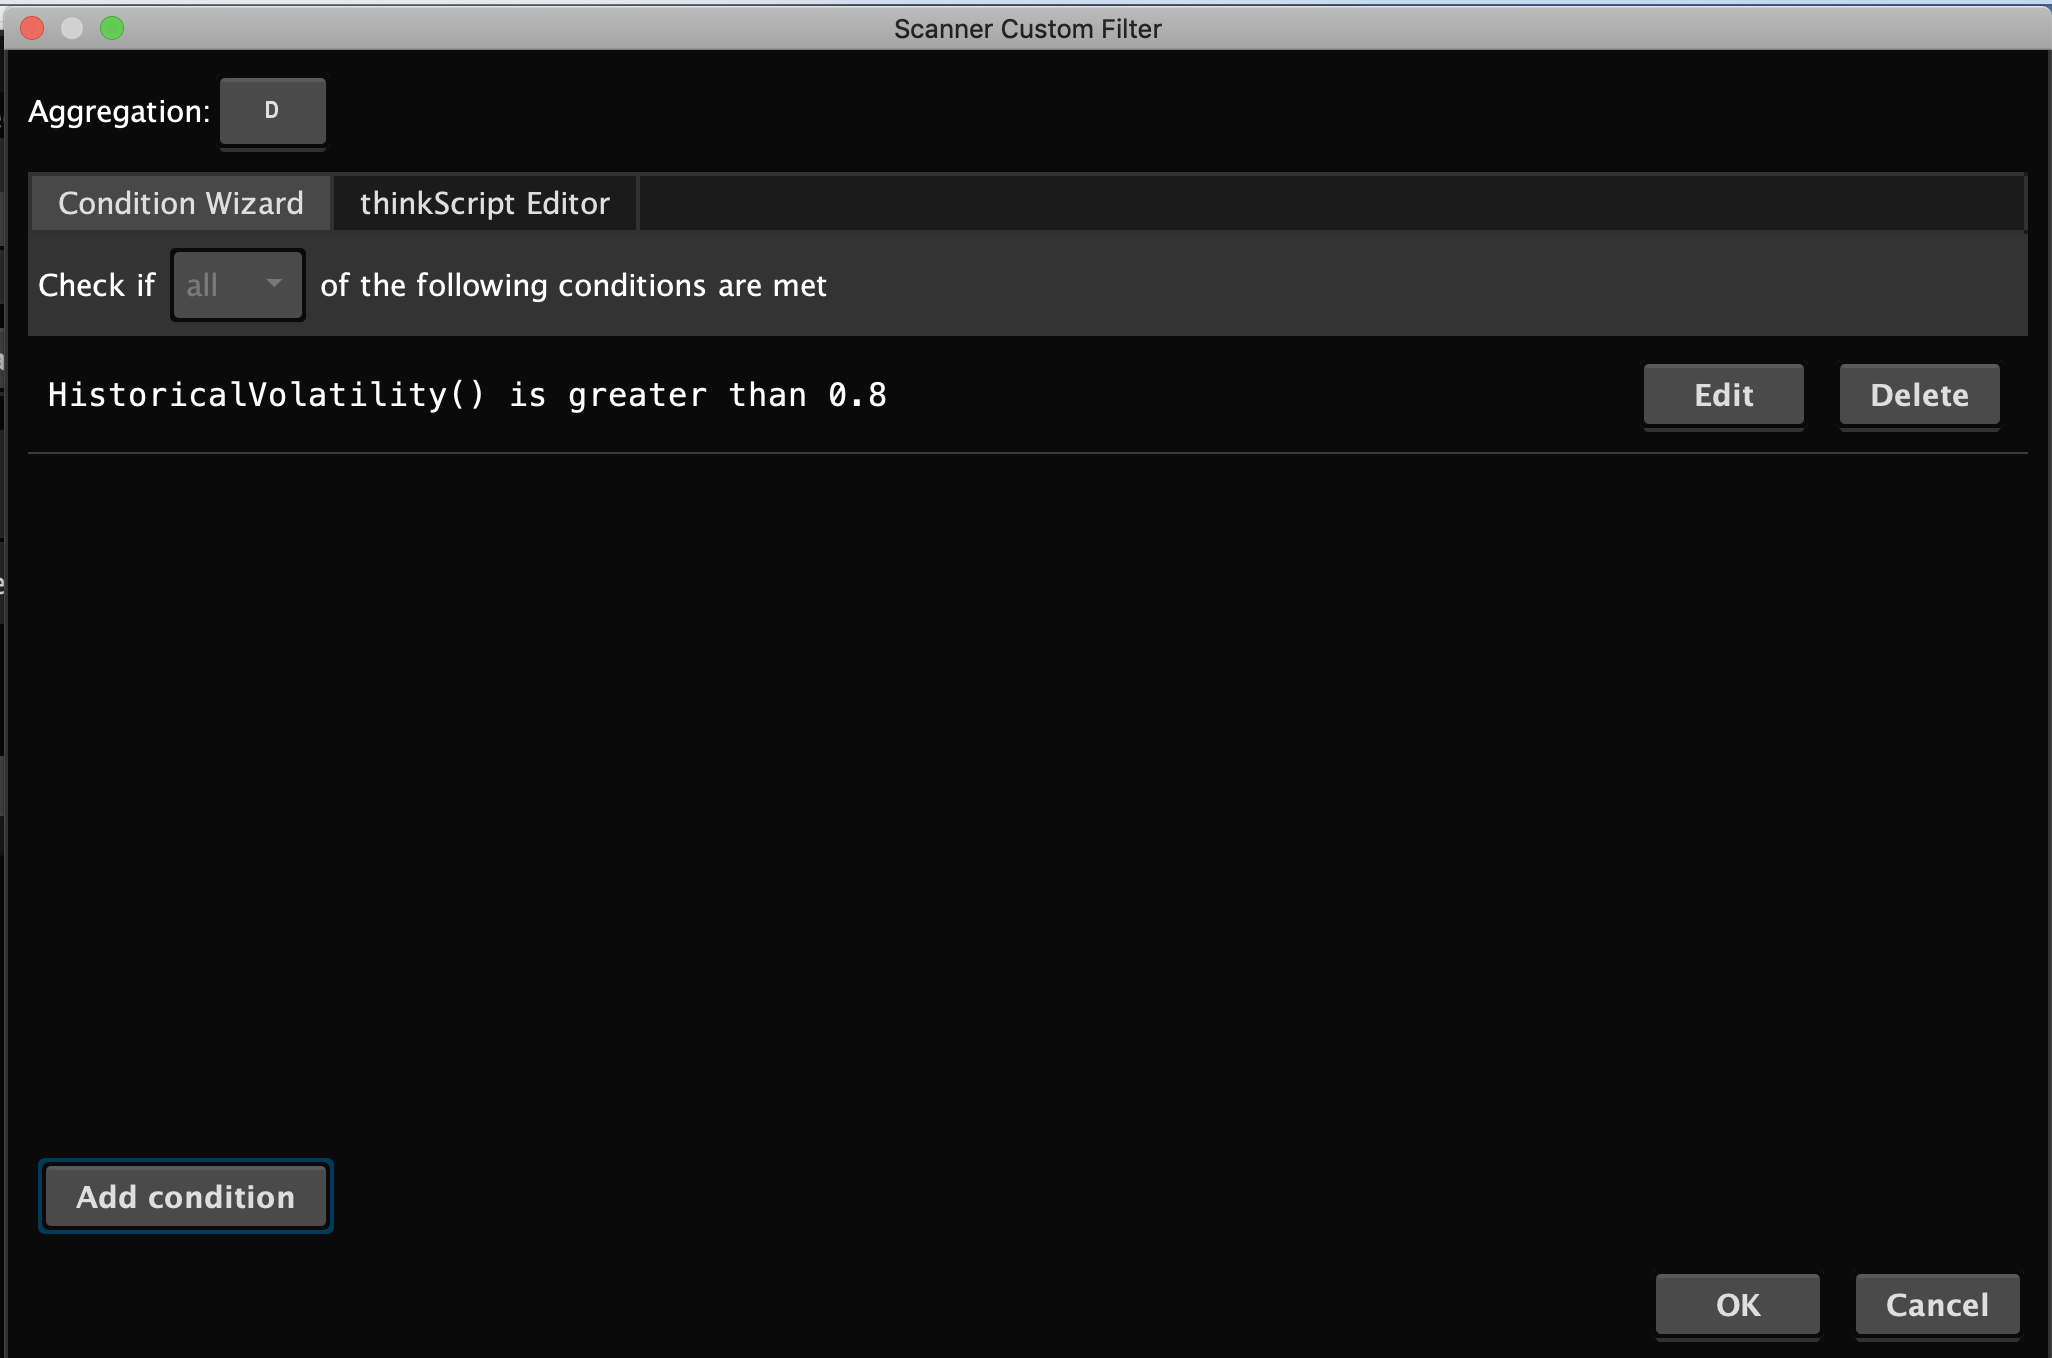
Ok, here is the scan for that:
def HV = HistoricalVolatility(30);
def HVAnnualHigh = Highest(HV, 252);
def HVAnnualLow = Lowest(HV, 252);
def Level80Pct = HVAnnualLow + (((HVAnnualHigh – HVAnnualLow) / 5) * 4);
plot scan = HV > Level80Pct;