| ♥ 0 |
Hello Pete, I have a stacked EMA watchlist column script(file attached) which shows when the 8,21,34,55,&89 EMA are stacked in that order. I want to add a counter to show the number of consecutive stacked bars. You can remove the labels Bl and Br for bullish and bearish if necessary. def EMA8 = ExpAverage(close, 8); def bullish = EMA8 > EMA21 and EMA21 > EMA34 and EMA34 > EMA55 and EMA55 > EMA89; ADDlabel(bullish, “Bl”, color.blACK); AssignBackgroundColor (if bullish then color.grEEN else if bearish then color.reD else color.wHITE);
Attachments:
Marked as spam
|

|
Private answer
Since you are requesting a solution for a custom watchlist column, I moved your question out of the "Frequently Asked Questions" topic and into the "Watch Lists" topic. This topic of counting the number of bars that a condition has been true has already been covered multiple times in this forum. The solution is very much the same regardless of the method used to define the true/false condition.
That's really all there is to it. You can copy and paste that into any code and substitute your own true/false condition in the first line. The solution becomes a bit more complex when you have two or more conditions you want to track. But the basic structure of counting bars since condition remains the same. If you want to learn how to apply the technique to a broader range of scenarios you can search the forum and find many examples. But here are a couple that come very close to matching this current request: https://www.hahn-tech.com/ans/display-number-of-bars-since-condition-was-true/ https://www.hahn-tech.com/ans/display-bars-since-cross-above-hma/ Here is the solution to your request. I have updated the variable names for the individual moving averages because other viewers might want to use a completely different set of values for each of those.
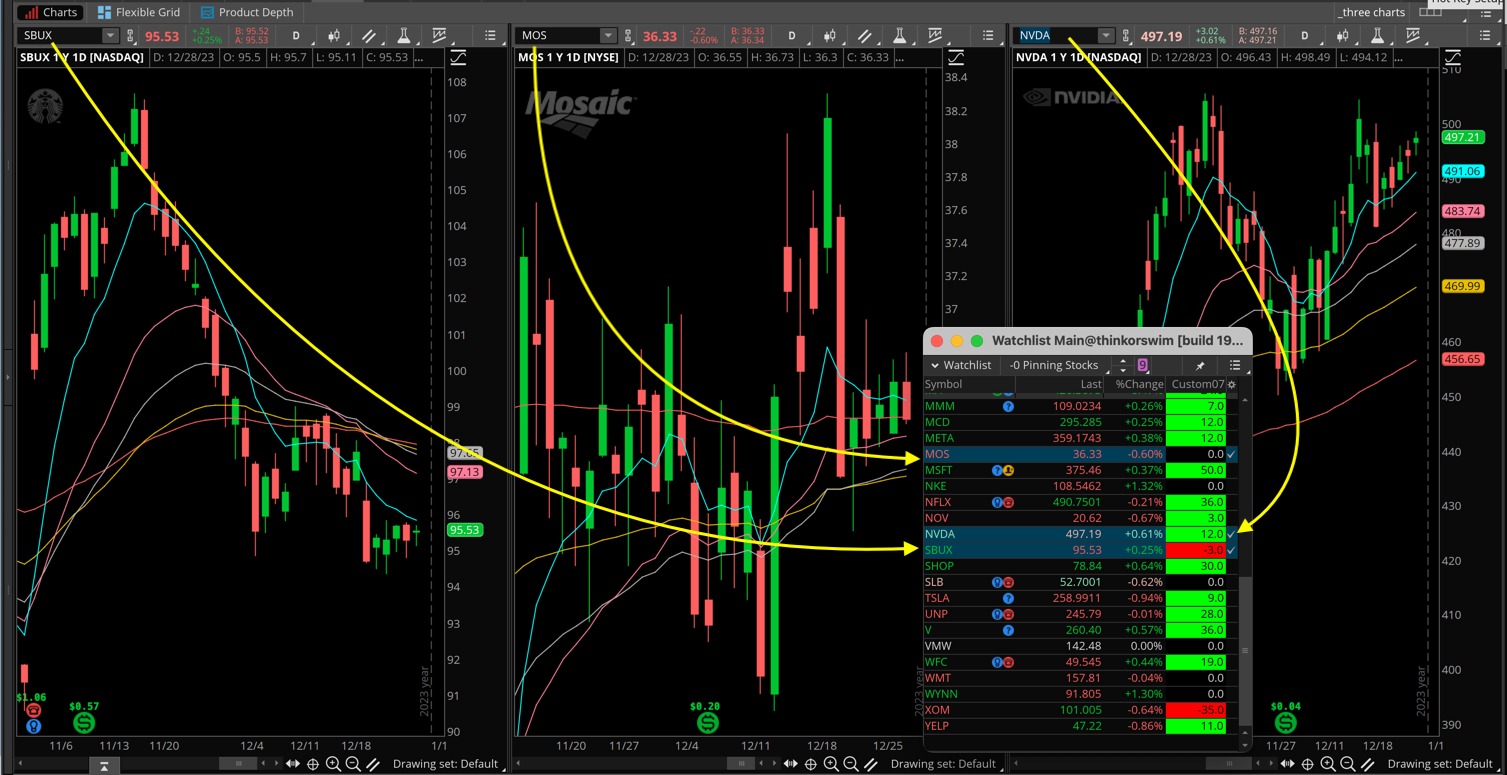
I have included a screenshot below showing a grid of three charts which shows ticker symbols from the embedded watchlist.
Attachments:
Marked as spam
Answered on December 28, 2023 10:39 am
|