Create and edit drawing tools from chart study


Category:
0
0

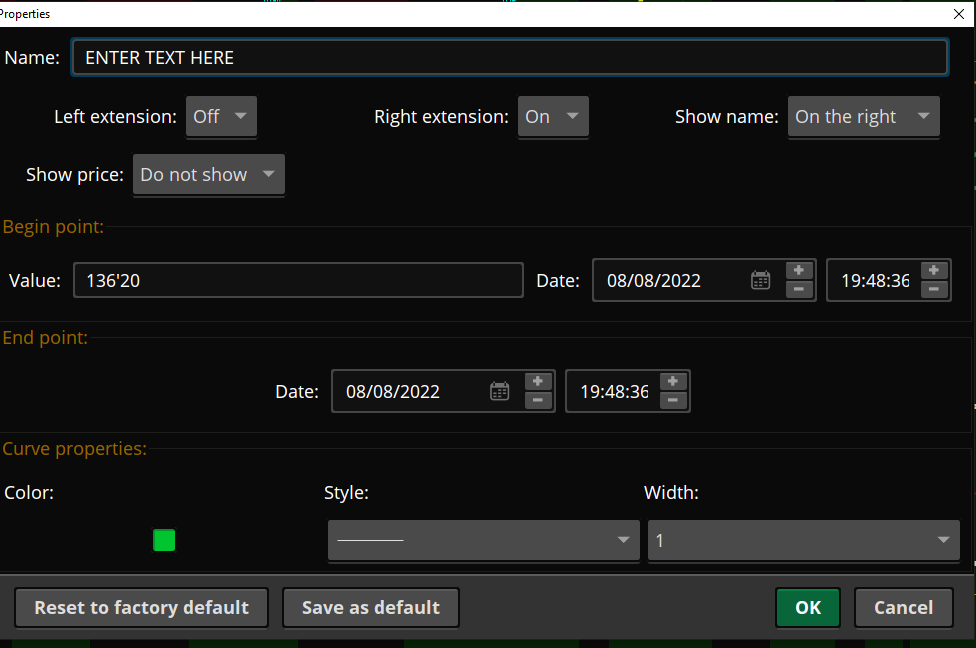
Hi Pete,

Trying to create a script that will allow me to manage multiple price levels inside of one indicator.

By way of background, when I create a Price Level (from Drawing Tools), if I double click on the level then a window appears which allows me to customize the properties of it. (Name Left Extension, Right Extension, Show Name, Show Price, Value, Color, Style, Width).

Desired script would allow me to add several different price levels, and to edit them all within the one indicator.  That way I can change the values of them on a daily basis without having to manually click on each price level in the chart every day.

Thanks for any ideas!

*I have attached a photo of the properties editor for the price levels in drawing tools


Attachments:
Marked as spam
Posted by (Questions: 7, Answers: 1)
Asked on August 25, 2022 2:01 pm
173 views
0
Private answer

I changed the title of your question to include the context of what you are trying to accomplish. The original title you entered missed some important details and I know that many users of Thinkorswim are searching for this very solution. The title I have chosen should make it much easier for other traders to locate this question when searching for this solution.

Now for the bad news. This is totally impossible to do on the current version of Thinkorswim. We can do this on many other trading platforms. However Thinkorswim does not provide any methods for creating or editing drawing tools on the chart.

So what can we do? On the current version of Thinkorswim we can:

  1. Add plot statements to plot data on the chart
  2. Add chart labels to display data in the upper left corner of the chart
  3. Add chart bubble to display data at specific time and price levels of the chart
  4. Add vertical lines to display data at specific times on the chart

That's all of it. We have only those four tools to work with when writing custom chart studies on the current version of Thinkorswim.

If you want to plot a flat horizontal line on a chart, the only option we have available is the following:

plot lineOne = 100;

You can change the color and style of the line through the Edit Studies window. But there are no properties which allow you to add a label to that line, or extend the line to the right or left.

Marked as spam
Posted by (Questions: 37, Answers: 4086)
Answered on August 25, 2022 2:44 pm