| ♥ 0 |
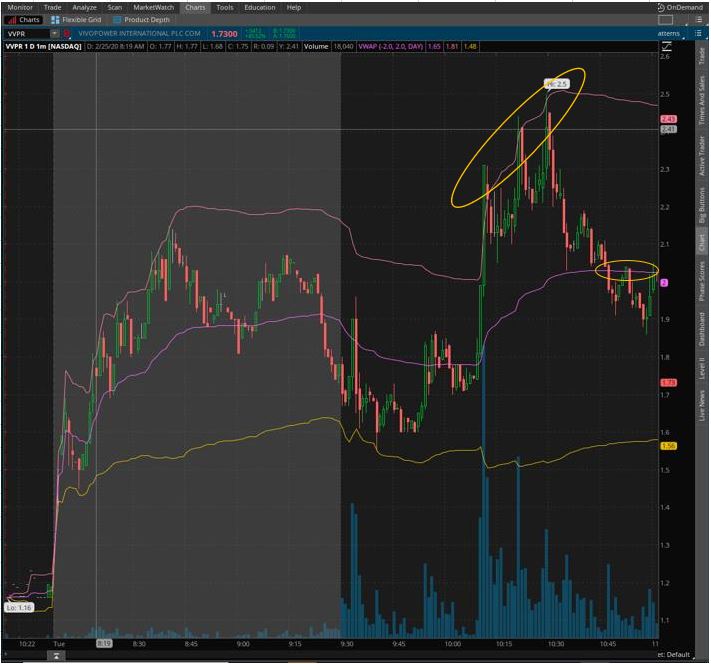
Hello Pete, I’m hoping you can help me with a scan to capture the criteria shown in the chart here. I would like the scan to find stocks that have touched or broken the upper VWAP at least twice, then have dropped through the mid VWAP line. This is a pattern I look for on the Daily 1M chart, usually occurs in the 10:30 – 12pm time frame. Thanks for your help and everything you do for us! Adam
Attachments:
Marked as spam
Asked on February 26, 2020 7:13 pm
114 views
|