| ♥ 0 |
Hi Pete, I would like to run a scan for stocks that have been above their ATRts for at least the last 10 days.
Marked as spam
Asked on February 28, 2017 11:37 am
983 views
|
|
Private answer
To create this scan you would copy and paste the code included in the built in version on Thinkorswim, named “ATRTrailingStop”.
Marked as spam
Answered on February 28, 2017 12:32 pm
|
|||||
|
Private answer
Great, that’s working. Perusing through the scan results, I’ve noticed that some stocks have spent more time above the ATRts than others. Is there a way to count how many days they have spent above the ATRts since crossing, so that the results can be sorted on the scan screen? Marked as spam
Answered on February 28, 2017 1:21 pm
|
|||||
|
Private answer
The scan column is producing results, but the numbers are way off compared to the bars on the chart that are over the ATRts. Your thoughts. Marked as spam
Answered on February 28, 2017 2:43 pm
|
|||||
|
Private answer
I’ve obviously overlooked something. The aggregation period is un-checked. For example, AAL shows up in the list with a value of 28 and it is not even above the ATRts, rather it has been below for over 20 bars (daily). I set up the scan and the custom column with this script. http://tos.mx/ibLgve
Marked as spam
Answered on February 28, 2017 8:13 pm
|
|||||
|
Private answer
When you referenced the aggregation period, I thought you were referring to the chart > settings > equities > start aggregation at market open, which is un-checked on the daily chart. The scan aggregation is set to “D”. There is a difference in the ATR Period, the ATR Factor and AverageType (EXPONENTIAL instead of WILDERS) from the TOS version, but that shouldn’t cause the issue I’m having. This is how the script looks for the custom column and the scan that I’m using. Assert(ATRFactor > 0, “‘atr factor’ must be positive: ” + ATRFactor); def HiLo = Min(high – low, 1.5 * Average(high – low, ATRPeriod)); def trueRange; def state = {default init, long, short}; def BuySignal = Crosses(state == state.long, 0, CrossingDirection.ABOVE); def changeOfState = state[1] == state.short and state == state.long; Marked as spam
Answered on February 28, 2017 10:14 pm
|
|||||
|
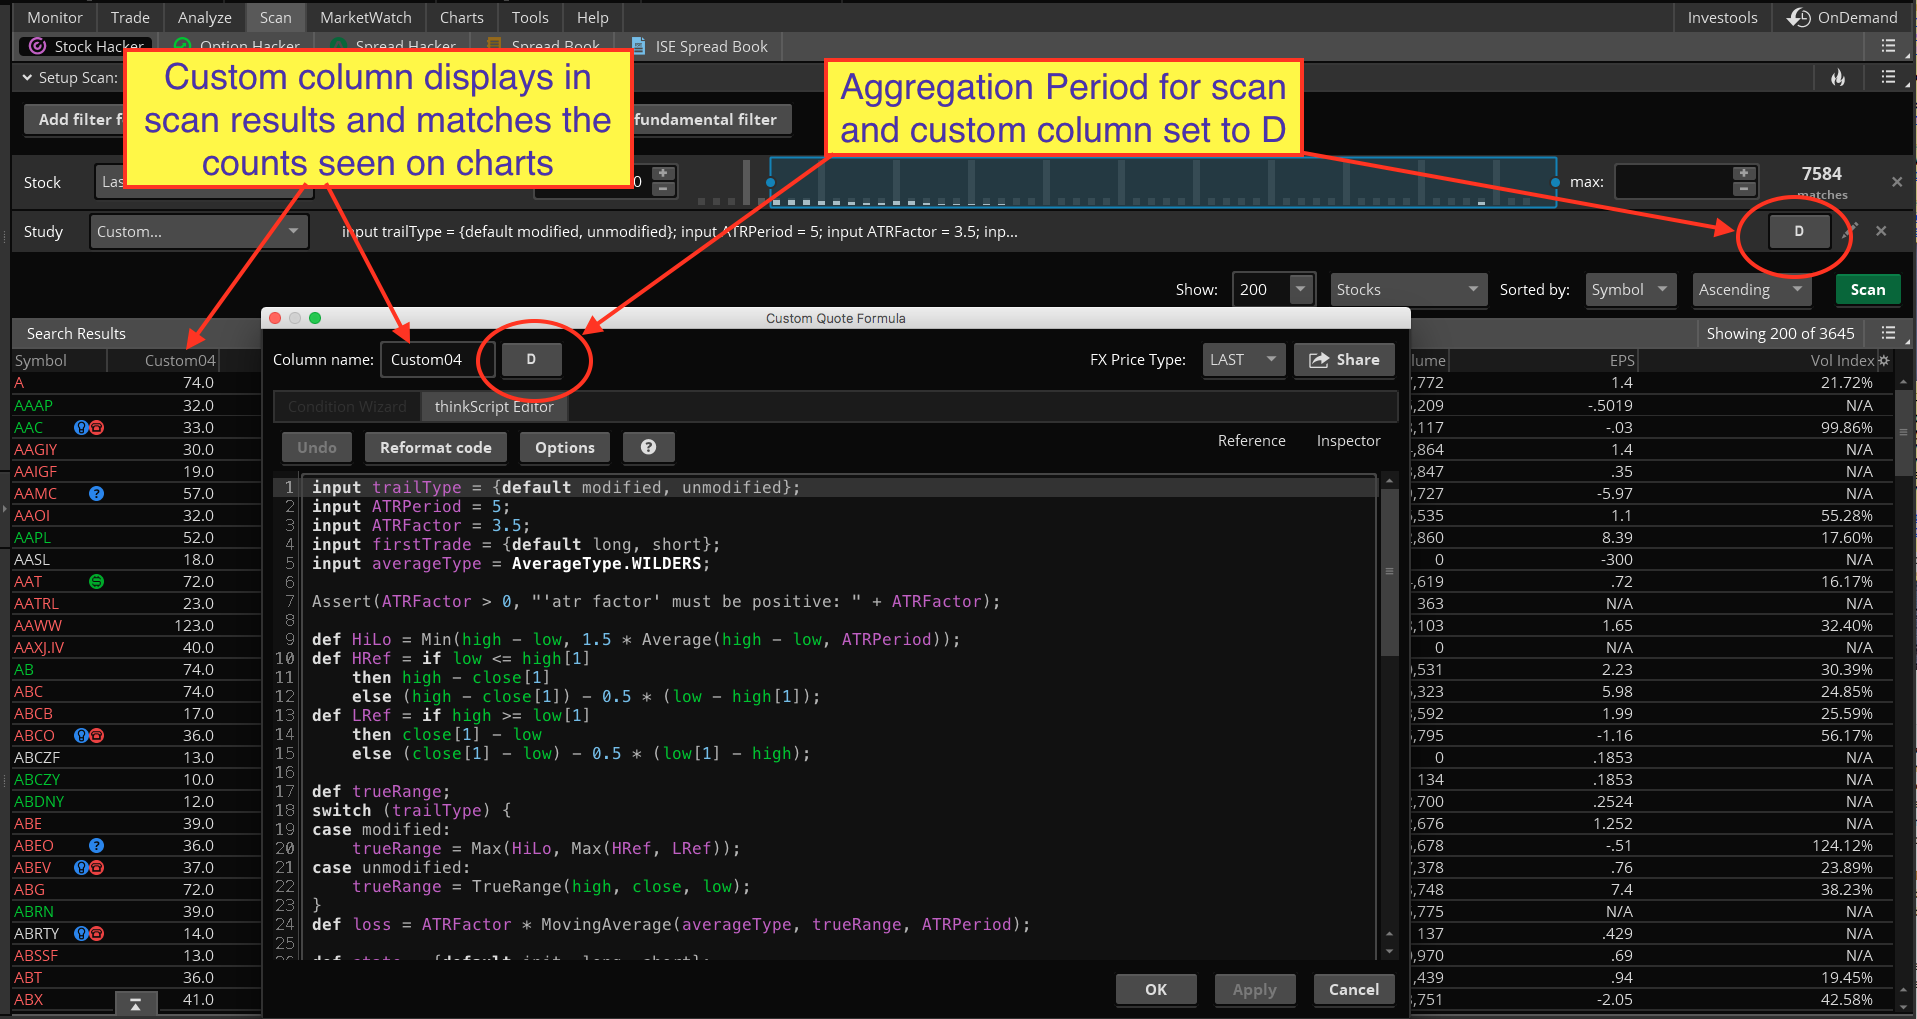
Private answer
See screenshot below. This shows the custom column in the scan results. You can see it is set to daily aggregation period and matches the aggregation period used for the scan. After spot checking several stock tickers on a daily chart I found the counts were an exact match. Attachments:
Marked as spam
Answered on February 28, 2017 10:23 pm
|
|||||
|
Private answer
First of all, my bad. I overlooked the aggregation for the custom column and fixed that so it is set to “D”. Now that everything is correct, just for grins and giggles, I ran the scan on the S&P 500 and it came back showing that 505 stocks meet the scan criteria. That can’t be right, so I started down through the symbols to look at their charts. The second symbol (AAL) shows it has been above the ATRts for 23 bars (my settings are slightly different than yours) and when I looked at the chart, AAL has been under the ATRts for 21 bars. It shows BBY being above for 156 bars, the last time it was above the ATRts was 12/20/16. The ATRts settings for the chart are identical to the scan settings. I am beginning to think there is something wrong with my computer or TOS. Marked as spam
Answered on March 1, 2017 7:21 am
|
|||||
|
Private answer
I followed your suggestion from scratch and I’m getting the same results I had before. The scan is returning all of the stocks in the S&P 500, for example and the numbers don’t make sense. This morning I also noticed that one of my other scans (in a watchlist) that has been working for months, is only partially working. It is on a daily time-frame and some of the others on different time-frames are working just fine, so I called TOS support. They installed a clean version and we still had the same issues. Aha…want to know something interesting? The ‘ol pea sized brain just had an idea. Daily appears to have a problem so I changed the ATRts (scan and custom column) to run on an hourly and everything is spot on. Guess I’m going to have to contact TOS and let them know what I found. Will keep you informed of what I find out. Marked as spam
Answered on March 1, 2017 10:21 am
|
|||||
|
Private answer
Ok Pete, here is the reply I received this afternoon from the TOS development team. I understand what he is saying about the script counting everything, which is why it’s counting when stocks are under the ATRts. Is there a way to stop the counter when the stock crosses under the ATRts so that only the longs are displayed? Hello Bob, Thank you for the message. There are a couple things you may want to look at to correct these studies. The issue with this study is occurring in the last several lines of the script. Below is a piece of the code you have emailed that is calculating a little differently than what you need. def BuySignal = Crosses(state == state.long, 0, CrossingDirection.ABOVE); def SellSignal = Crosses(state == state.short, 0, CrossingDirection.ABOVE); def changeOfState = state[1] == state.short and state == state.long; rec longStateCounter = CompoundValue(1, if changeOfState then 1 else longStateCounter[1] +1, 0); plot data = longStateCounter; This section of the first script uses the change of state variable you have defined to reset the counter back to 1. The issue here is that there is nothing set to reset the counter when the ATR flips to a short indicator. So the counter will count even while the ATR has flipped and then reset when it becomes a long indicator once more. You will want to define a condition to reset the counter when the ATR is giving a short indicator as well. I hope this helps. If you have additional questions please let us know. Garrett Kelly Thinkscript
Marked as spam
Answered on March 7, 2017 6:00 pm
|
|||||
|
Private answer
Please accept my apologies for any confusion I may have caused. After reading your recent post, I realized I misread how to utilize the scans. I went back and reset everything per your suggestions and all is working as you stated it should. Again, thank you for your patience, persistence and experience. Marked as spam
Answered on March 8, 2017 8:13 am
|
|||||
|
Private answer
Now that everything is working in the long direction, I thought it would be simple to reverse the scan in the short direction, however it’s not. Here’s what I changed and it is not showing just those stocks that have been under the ATRts for 10 days or more, instead it is showing all of them. How do I get the scan to obey your command? def BuySignal = Crosses(state == state.long, 0, CrossingDirection.ABOVE); Marked as spam
Answered on March 21, 2017 2:08 pm
|
|||||
|
Private answer
Now that I think about it, that scan logic makes sense. Thanks for that. The counter is exactly what I was using, but didn’t include it because I thought there was something wrong with the scan. Now that the scan is fixed, the counter is working just fine. On my scan results screen I have a column for short counts and a column for long counts, now if I run a scan for just the longs, the results populate as expected and numbers for the short count are also appearing, but they are completely wrong. If I run a long scan for example, shouldn’t the short column just be blank? The long column doesn’t even mention the short counter. This is how the long counter appears: def BuySignal = Crosses(state == state.long, 0, CrossingDirection.ABOVE); def changeOfState = state[1] == state.short and state == state.long; Marked as spam
Answered on March 21, 2017 4:45 pm
|
|||||
|
Private answer
Will give it a try. Thanks. Marked as spam
Answered on March 21, 2017 6:45 pm
|
Yes, we can do that with a custom column in a watchlist technique. The columns in the scan results can take custom script just like watchlists and the MarketWatch screen.
Using the same code from the built in ATRTrailingStop, we delete the same lines as before and then we need to add a few new ones.
def changeOfState = state[1] == state.short and state == state.long;
rec longStateCounter = CompoundValue(1, if changeOfState then 1 else longStateCounter[1] +1, 0);
plot data = longStateCounter;