EMA Highs, new low


Category:
0
0

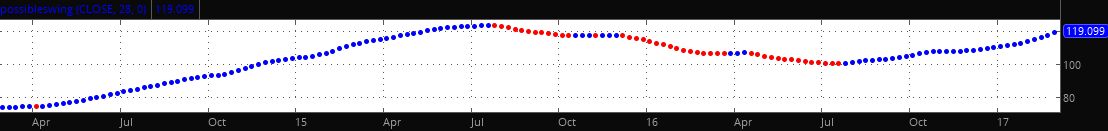
How can I scan for a stock’s 28 EMA within 5% of the 52 wk highs but the 28 EMA is now below the price the 28 EMA was at yesterday  (if it’s possible, on a weekly time frame.)

I attached a screenshot below. So we are pretty much scanning for when the 28 EMA goes from blue to red (red means the plot was lower than the previous day’s price) but the blue to red move has to be within 5% of the 52wk high.


Attachments:
Marked as spam
Posted by (Questions: 34, Answers: 56)
Asked on February 27, 2017 9:58 am
98 views
0

How would I make the inverse of this? Meaning it’s within 5% of a yearly low but just made a new high on the 28 EMA (red to blue)?

( at February 27, 2017 10:28 am)
0

Need to clarify something. You ask ”if it’s possible, on a weekly time frame”. We have a contradiction which prevents this: ”below the price the 28 EMA was at yesterday”, which is not possible to measure from a weekly time frame. There is no ”yesterday” in the weekly chart. Only this week, last week and next week.
So, we are going to build this to run on the daily time frame. Next question. The 28 EMA, is that the Daily 28 EMA? Or some other time frame?

( at February 27, 2017 10:43 am)
0

Daily

( at February 27, 2017 1:12 pm)
1
Private answer

Ok, I think this should do the job. Looking back at your previous posts, I am not sure if you are trying to learn how to write thinkscript or just looking for quick solutions. So let me know if you need any of this explained. Most of the questions you have posted have been very elementary. If you were trying to learn this, I would expect you to provide your own code showing your best attempt. Then ask for guidance on how to make it work.

def ema28 = ExpAverage(close, 28);
def highOfYear = Highest(high, 252);
def lowOfYear = Lowest(low, 252);
def decliningEMA28 = ema28[1] > ema28;
def ascendingEMA28 = ema28[1] < ema28;
def percentEMA28fromHighs = 100 * (ema28 / highOfYear - 1);
def percentEMA28fromLows = 100 * (ema28 / lowOfYear - 1);
# scan for 28 ema 5% or less down from highs and one day down
plot scan = decliningEMA28 and percentEMA28fromHighs >= -5.0;
# scan for 28 ema 5% or less up from lows and one day up
#plot scan = ascendingEMA28 and percentEMA28fromLow <= 5.0;

Marked as spam
Posted by (Questions: 37, Answers: 4084)
Answered on February 27, 2017 3:20 pm
0

Thank you so much, I have been picking up a lot from a lot of your scripts, I plan to learn more as I go along with my trading journey.

( at February 27, 2017 6:00 pm)
0

Don’t forget to up-vote any questions that best solve your question! Other folks will be searching for answers.

( at February 27, 2017 6:38 pm)
0

Pete Hahn, I have written some code but I am having some trouble.
I want to plot a line 10% below the close of the current day. Here is what I have so far:

plot 10under = close * .90

( at February 27, 2017 7:09 pm)
0

That is fine except the compiler does not allow variables or plot names that begin with a number. Just change it to under10. The statement you have there will work on a daily chart. But you will have a line across every bar on the chart that is 10% below each candle’s close.

( at February 27, 2017 7:24 pm)
0

Thanks!! ?

( at February 27, 2017 7:31 pm)
0

(This line is 5% below the value of the 28 EMA). What do I need to add so that this will be able to scan for stocks that
closed 5% below the ”primaryfloor”?

def ema28 = ExpAverage(close, 28);
def primaryfloor = ema28 * .95;
def farfromfloor = close

( at February 27, 2017 7:51 pm)
0

Should be:
plot scan = farfromfloor <= primaryfloor;

( at February 27, 2017 8:00 pm)
0

Ok, thanks!

( at February 28, 2017 4:02 am)