| ♥ 0 |
Hi Pete. I found your website about 2 weeks ago and it is awesome. Thank You! I reviewed the QA forum and was able to set up the squeeze histogram color in my watchlist. Can you help me with customizing my watchlist so that the color of the TTM C wave histogram appear in my watch list? I reviewed the post that explains how to assign a color to the A wave but I am having trouble with creating a code for the C Wave histogram.
Marked as spam
Asked on November 10, 2018 12:07 pm
743 views
|
|
Private answer
Since your question title was so close to the one that covers the A Wave I update your title to show you are requesting a solution using the C Wave. Here is a link to that original post: https://www.hahn-tech.com/ans/ttm-wave-custom-color-watch-list/ Next, I searched the Q&A forum to locate another post where someone requested a scan based on the C Wave changing color: https://www.hahn-tech.com/ans/scan-for-identifying-stocks-with-ttm_wave-c-in-cyan-color-indicating-expansion/ I did that mainly because I am lazy. And the code from post does 99% of what we need for this request. In fact I only need to add a single line of code to convert that to color a custom watchlist column. But I also included that link because in that post we explain very clearly how the color change is determined and what it means for the interpretation of the C Wave.
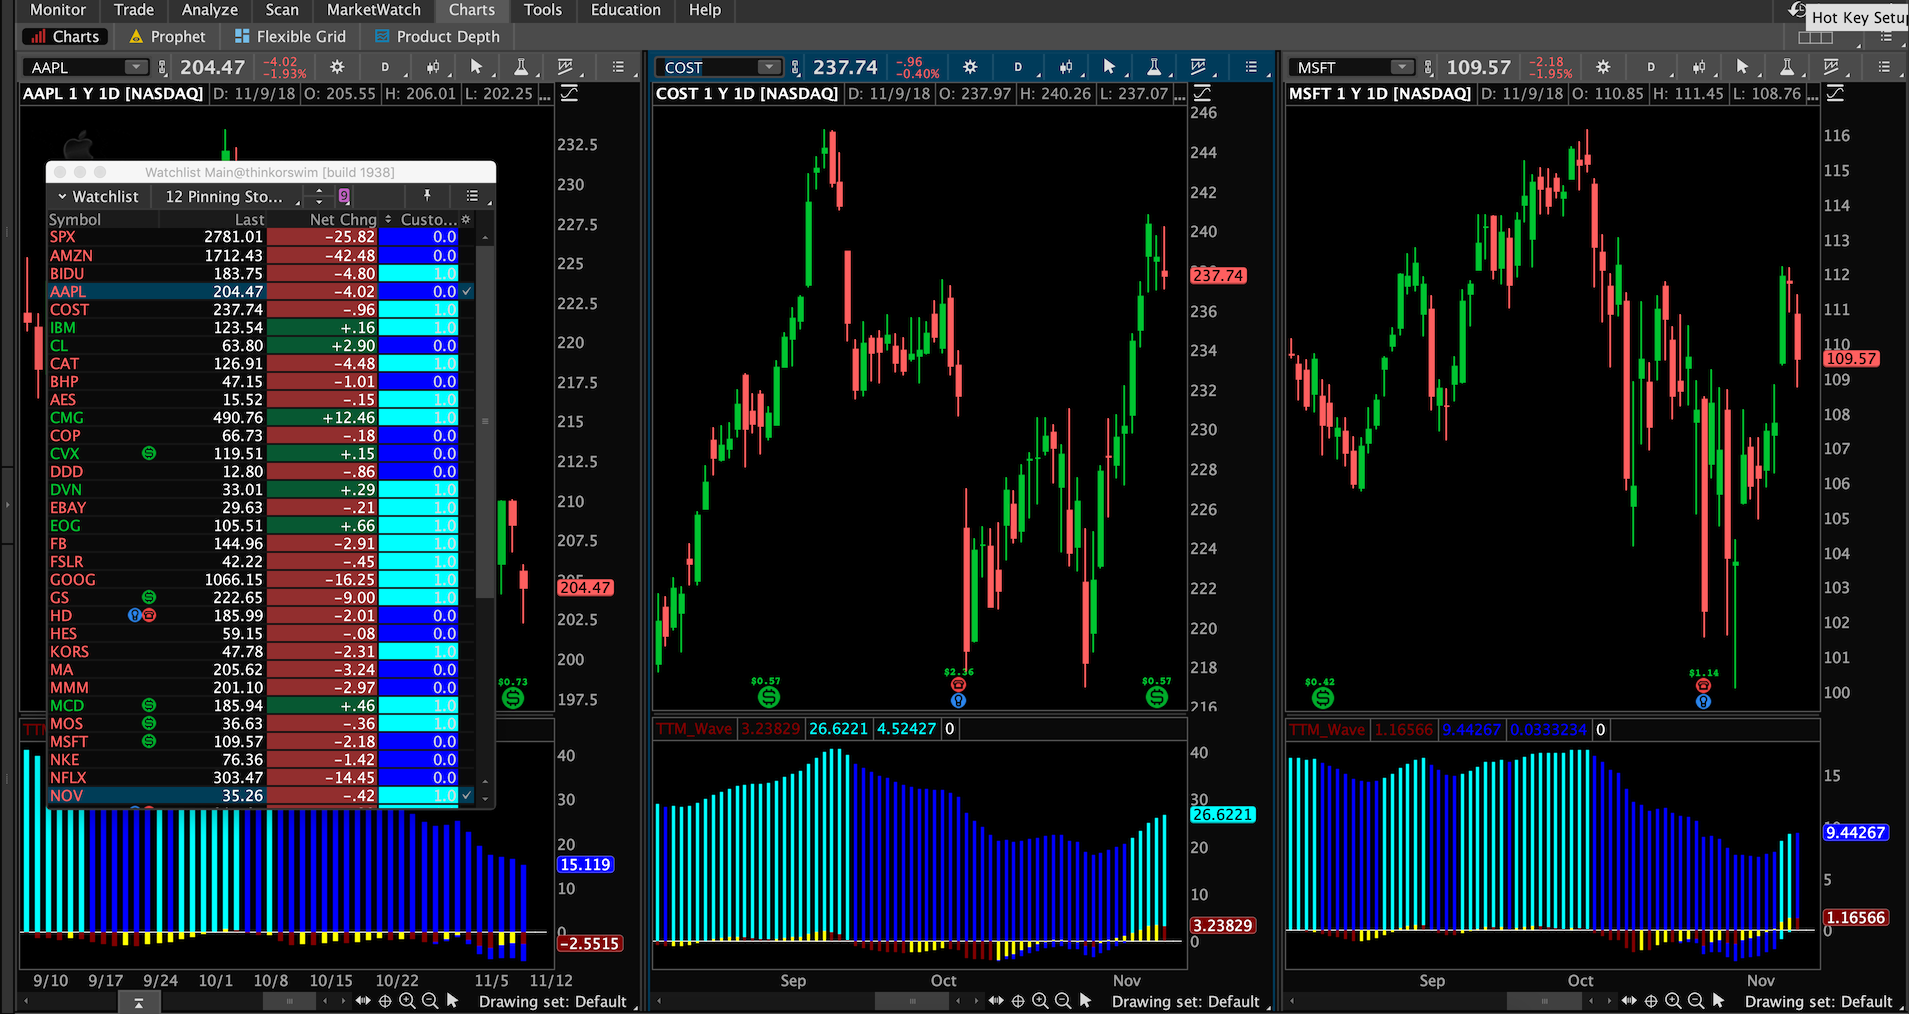
Screenshot below shows the result. Attachments:
Marked as spam
Answered on November 10, 2018 1:46 pm
|