Display previous bar close in price range of chart


Category:
0
0

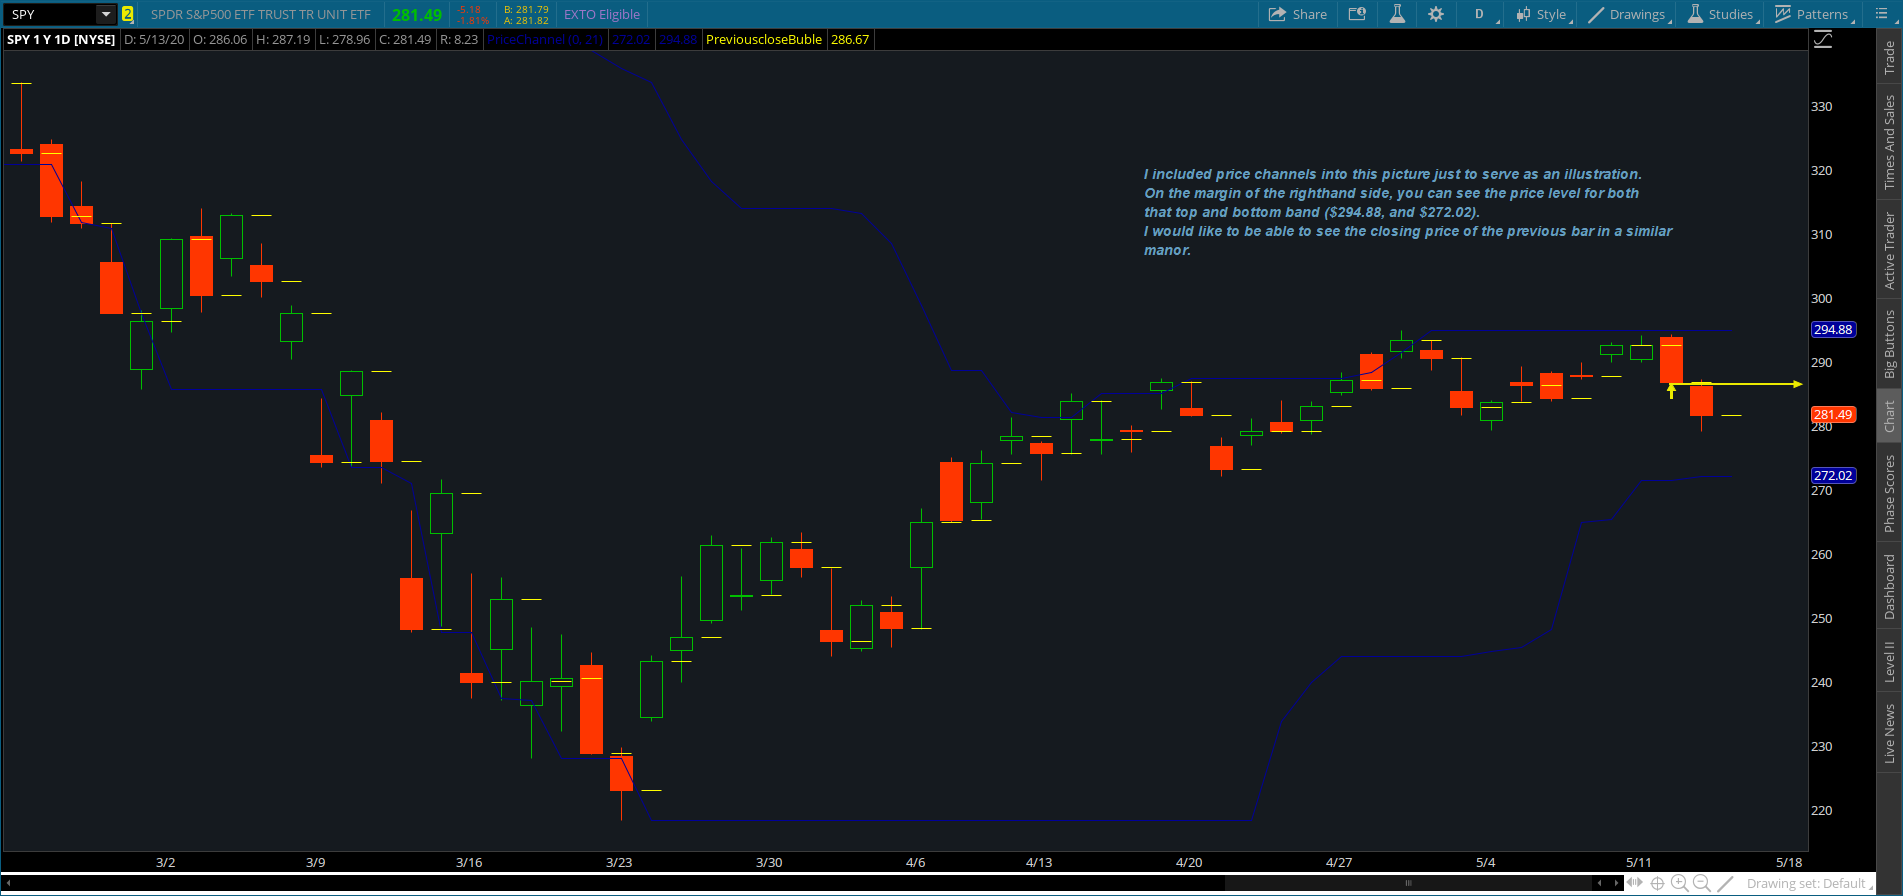
If you look at the price levels on the right hand side of the screen it will include a bubble with that level. In order to not see that bubble, you have to go to the sprocket for that indicator that I have above and deselect show bubble. My goal is to be able to see the previous close in the right margin because it will make it easier to know if price has broke that previous close (and what that level is) as I buy/sell based upon that level. Yes, you could just pull up a data box and hover over it and you would get the level. Yet by having a bubble just like all other indicators do without deselecting show bubble, you can see them on the right hand side enabling faster execution of the trade.


plot Data = close[1];

Data.setDefaultColor(Color.YELLOW);
Data.SetpaintingStrategy(PaintingStrategy.DASHES);

Attachments:
Marked as spam
Posted by (Questions: 15, Answers: 23)
Asked on May 13, 2020 1:12 pm
46 views
0
Private answer

Thanks for reposting this and including a screenshot. That really helps to explain things clearly. I have updated the title of the question so that we don't confuse this request with an actual chart bubble that displays text above or below the candles of a chart.

So what we need to do here is to define the last bar on the chart. We use that section of the code to control the reference point and prevent this displaying for every bar on the chart.

def lastBar = !IsNaN(close) and IsNaN(close[-1]);
plot previousClose = if lastBar then close[1] else Double.NaN;

Marked as spam
Posted by (Questions: 37, Answers: 4087)
Answered on May 13, 2020 2:37 pm
0
Awesome! Thanks Pete, this is exactly what I was looking for!
( at May 13, 2020 2:44 pm)