| ♥ 0 |
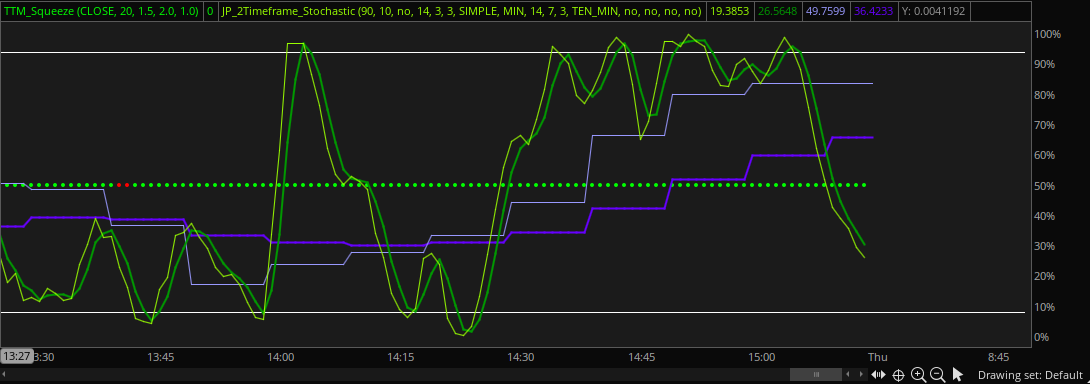
Hello. I am trying to implement a two timeframe stochastic on a one minute chart on ToS by adapting some code I found online. The 1 min stochastic is fine, but the 10 min is plotted like a step function. I assume because its calculating and plotting on every bar instead of on every tenth bar. Not sure how to fix this. Any ideas? Here is the relevant code: <pre> def ml = (over_bought + over_sold)/2; # TF1 def TF1_lowest_k = Lowest(T1L, KPeriod1); plot TF1_FullK = # TF2 def TF2_lowest_k = Lowest(T2L, KPeriod2); plot TF2_FullK = </pre>
Attachments:
Marked as spam
Asked on May 13, 2020 8:08 pm
190 views
|
|
Private answer
Stair-step pattern. So this is you very first foray into the world of referencing secondary aggregation periods (also referred to as multiple time frames). There is no "fix" for this. It is simply the nature of this new reality you have discovered. Mark this date on the calendar. You'll want to remember when you first came to understand this. Take the most basic example of plotting a series of data from the 1 hour time frame on the 15 minute chart. There are exactly 4 of each 15 min bars that are combined to create a single 1 hour bar. So when you plot the 1 hour close on a 15 min chart you end up with a stair-step pattern that changes to a new value every 4th 15 min bar. You may want to go back and read that paragraph 2-3 more times. This is important, and not very intuitive. Now that you have discovered this. You absolutely must understand the consequences and pitfalls. On your own, it may take you several years to come to understand these details. (I am speaking from experience). Or you can take a couple of hours out of your day and view the following videos: https://www.hahn-tech.com/thinkorswim-mtf-macd-indicator/ https://www.hahn-tech.com/thinkorswim-strategy-guide-mtf/
Marked as spam
Answered on May 13, 2020 9:14 pm
|