Display Year to Date Percent Change


Category:
0
0

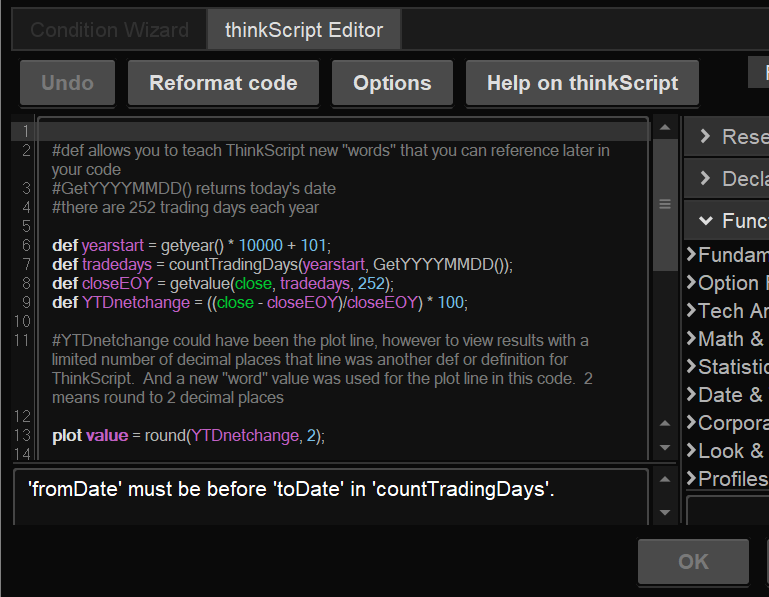
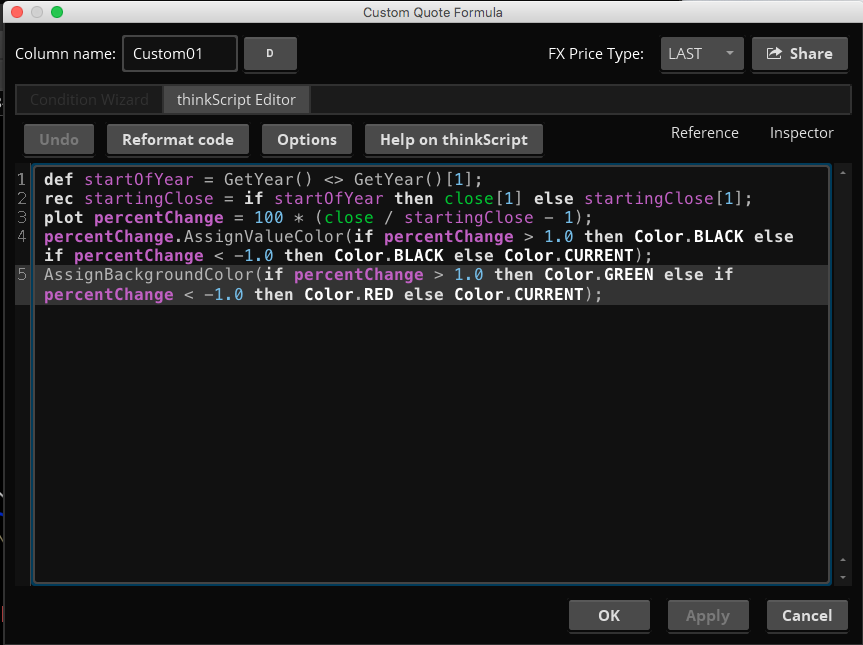
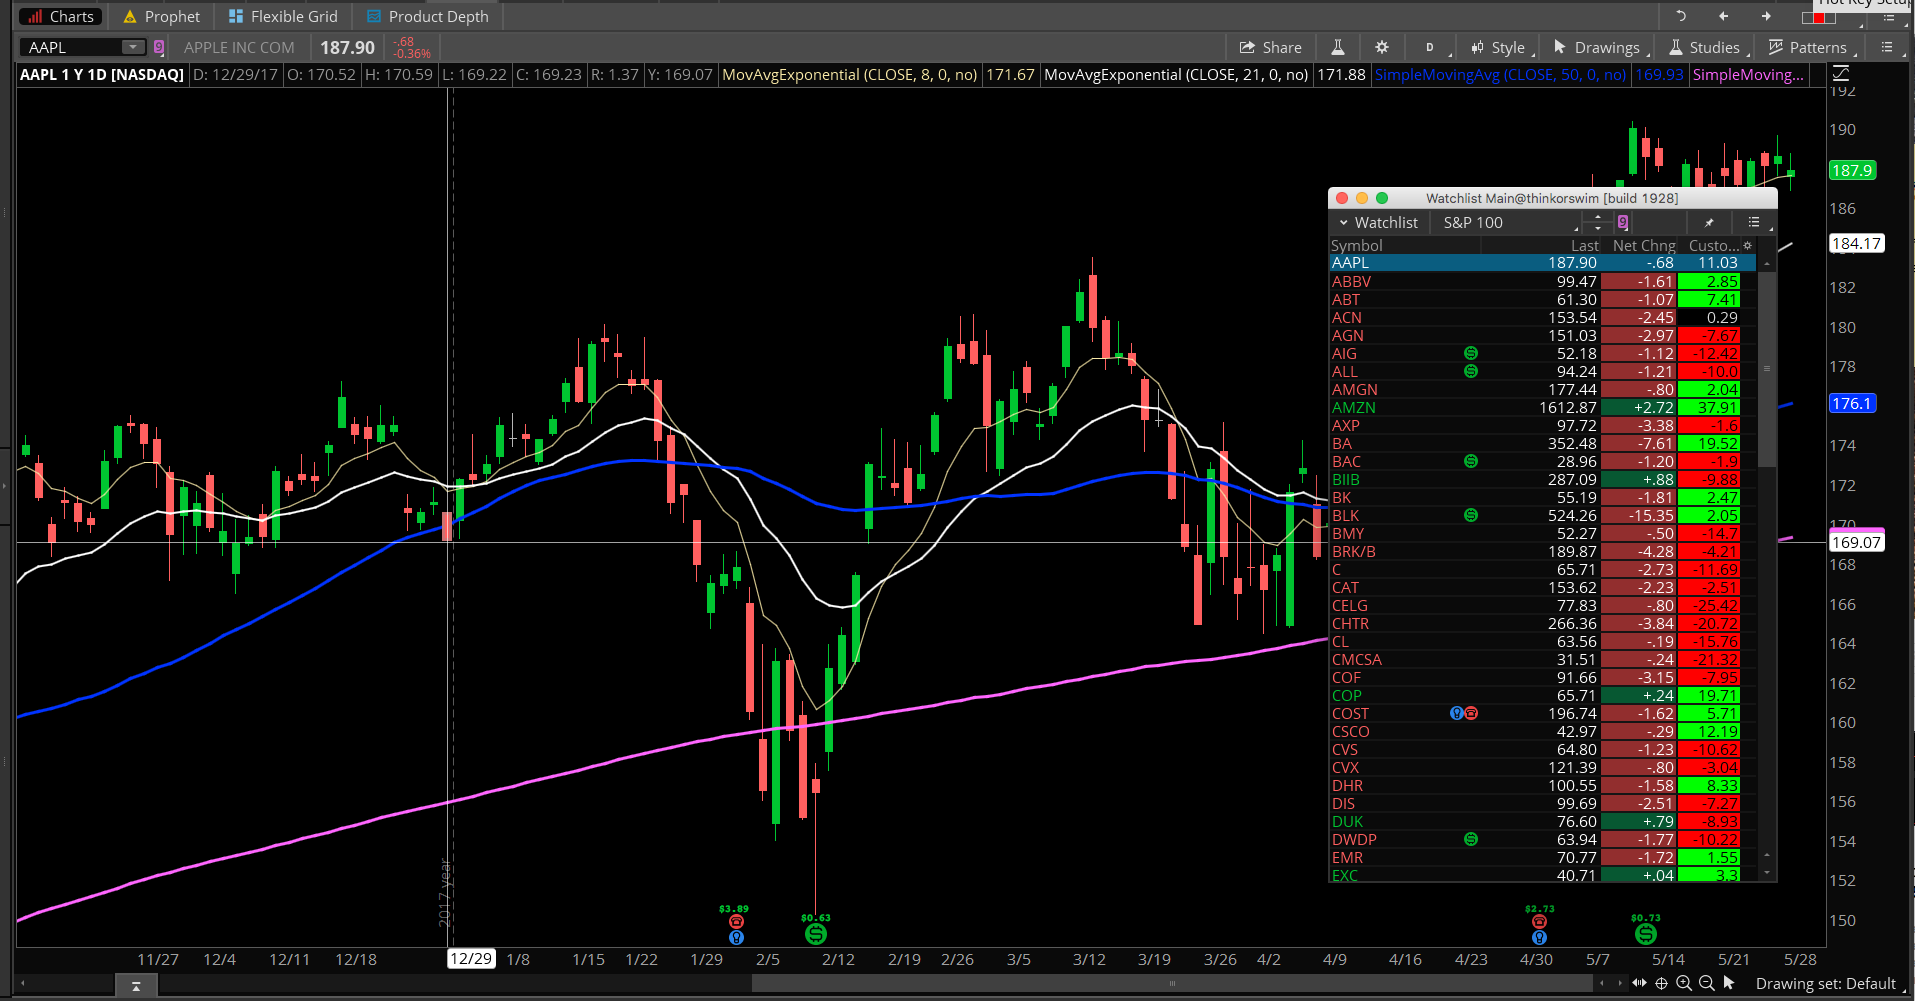
Hello traders,

I found this script a while back that attempts to plot the ytd% return on a tos watchlist column, but I keep getting notified of a script error at the bottom. Also trying to make it where above 1% returns are green…. and below -1% returns are red. Any help correcting this would be appreciated. Thanks guys. Happy trading

#def allows you to teach ThinkScript new “words” that you can reference later in your code #GetYYYYMMDD() returns today’s date #there are 252 trading days each year

def yearstart = getyear() * 10000 + 101; def tradedays = countTradingDays(yearstart, GetYYYYMMDD()); def closeEOY = getvalue(close, tradedays, 252); def YTDnetchange = ((close – closeEOY)/closeEOY) * 100;

#YTDnetchange could have been the plot line, however to view results with a limited number of decimal places that line was another def or definition for ThinkScript. And a new “word” value was used for the plot line in this code. 2 means round to 2 decimal places

plot value = round(YTDnetchange, 2);

Attachments:
RESOLVED
Marked as spam
Posted by (Questions: 11, Answers: 10)
Asked on May 29, 2018 12:25 pm
2644 views
0
Private answer

The Problem

I find this code has a fatal flaw. The error message makes the point pretty clear. The fromDate variable must be before (less than) the toDate. The problem occurs because for every bar on the chart this code is being evaluated. When the code assigns yearstart it does so for each bar on the chart. I keep saying chart and this is a watchlist. But it helps if you understand this from the perspective of the chart.

So for each bar available to the watchlist the code assigns yearstart = GetYear() * 10000 + 101. Which the author obviously intended to compute as: 2018 * 10000 + 101 which equals 20,180,101. That would be Jan 1st of 2018. But you have bars being evaluated that are from the year 2017. So each bar’s date is going to impact this assigned value of the yearstart variable.

Did you get that?

Do you see the problem here? The code is written expecting the yearstart to be a static value, the same for every bar being evaluated. This would only be the case on an intraday time frame the historical data available to a custom watchlist is less than 1 year.

But it’s worse than that

And despite what the comments say at the top of this code. GetYYYYMMDD() does not return today’s date. It returns the date of the current bar.

If you followed all of that you see that the error is actually stating: “The fromDate cannot be the same as the toDate”. Because they it is written these two variables are always equal. They are the same thing.

The Code

Ok, enough with all that. The code never worked in the first place. The author should have known this and never published it. But that is water under the bridge. Here is a much more elegant and reliable way to achieve the stated goal. Screenshot included below showing the result.

This MUST be set to a daily time frame. It will NOT work on any intraday time frame.

def startOfYear = GetYear() <> GetYear()[1];
rec startingClose = if startOfYear then close[1] else startingClose[1];
plot percentChange = 100 * (close / startingClose - 1);
percentChange.AssignValueColor(if percentChange > 1.0 then Color.BLACK else if percentChange < -1.0 then Color.BLACK else Color.CURRENT); AssignBackgroundColor(if percentChange > 1.0 then Color.GREEN else if percentChange < -1.0 then Color.RED else Color.CURRENT);


Attachments:
Marked as spam
Posted by (Questions: 37, Answers: 4084)
Answered on May 29, 2018 5:34 pm
0

Hello Pete………is there a way to add the “%” to the end of each of the values?

( at June 2, 2018 5:52 am)
0

You can. But that column will not sort correctly. You can see how it’s done in this post: https://www.hahn-tech.com/ans/how-to-create-a-watch-list-that-calculates-change-in-last-5-minutes/

( at June 2, 2018 8:14 am)
0

ok thanks

( at June 2, 2018 11:20 am)
0
Great Script! I have a follow up question. If you don't want YTD but instead want to choose past one year, how would you change the script? Sorry newb here. Thanks in advance.
( at February 25, 2020 1:59 pm)
0
Historical data for any custom watchlist column will be dictated by the following: https://tlc.thinkorswim.com/center/howToTos/thinkManual/MarketWatch/Quotes/customquotes So if you set the custom column to a weekly time frame it is possible to look back as far as 3 years. This would require the first two lines of code to be replaced. But that is a topic for a new post as the solution is too complex to deal with in the comment section of this post.
( at February 25, 2020 6:11 pm)