| ♥ 0 |
Hey guys 🙂 Im basically a noob and have never coded in my life. I thought I’d start with thinkscript since I trade all the time and I want to become a trader once I am accepted and graduate university.
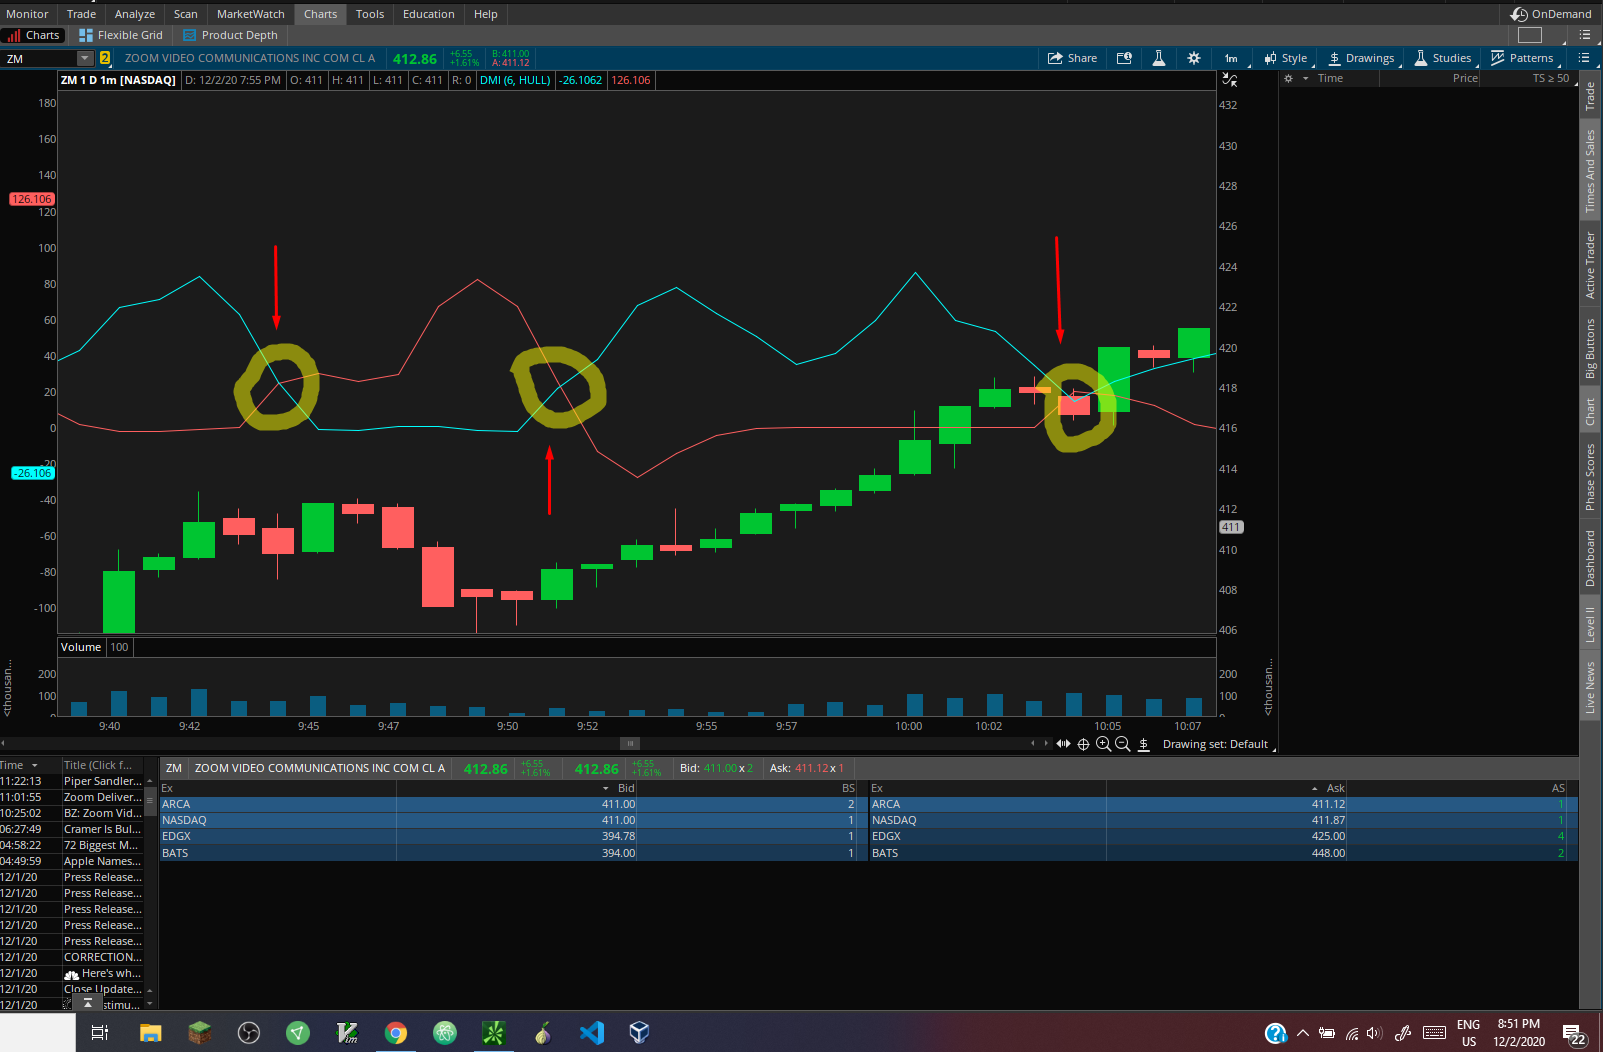
The question I have is: Does anyone know how to set it up so that an arrow pointing up will appear BELOW the current candle stick when the DMI+ crosses above the DMI- and another arrow pointing down that will appear ABOVE the current candle stick if the DMI- crosses above the DMI+?
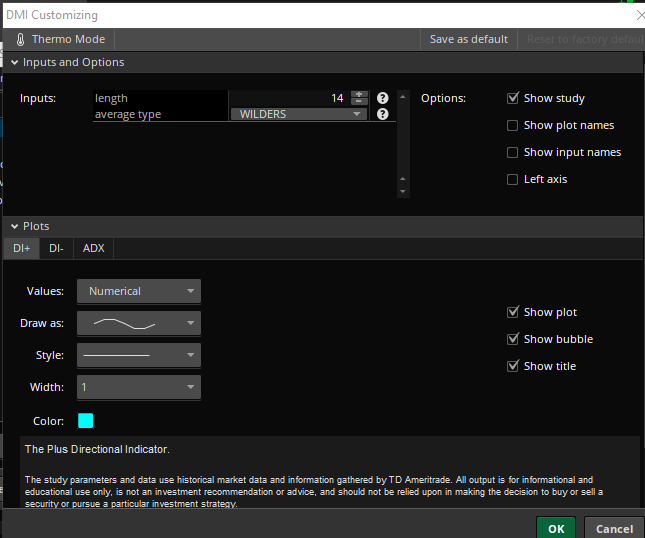
The typical settings I use for DMI is I set the mov avg to Hull and a length of 6.
If anyone would happen to have the code to something similar to this or even the exact code, I would really appreciate it. Also, if you do have a similar script, It would be really helpful if you were to mark the portion of the code where you were able to add arrows based on if a certain condition was met. thanks
samiveliutrading@gmail.com Insta: SamiVeliu Attachments:
Marked as spam
Asked on December 2, 2020 6:53 pm
318 views
|
|
Private answer
If you want to learn how to do these I suggest you spend time browsing the solutions in the "Stock Scanner" topic. Why? Because a scan is a true/false condition. True for a handful of bars where the condition is valid and false for the rest of the bars on the chart. That is the foundation for every study that plots arrows on the price graph. In fact they can be directly converted from one to another with some very simple adjustments to the code. Check the previous post I found in the "Stock Scanners" topic. Be sure to read all the details on that page so you understand the context and the solution. https://www.hahn-tech.com/ans/scan-dmi-plus-crosses-dmi-minus/ Now I'll show you how to convert that to a chart study that plots arrows on the upper price graph. Here is the code I directly copied from that post, excluding the four lines of code at the very bottom that constitute the signals used specifically for the scan:
This is your foundation. Everything you need to complete this is right there. You only need to change the last two lines from "def" to "plot" and add the style statements that configure those plots to paint arrows on the price graph. Here are those last two lines from the code above, modified as I just described:
Done. Yep, it is that simple. I have taken the last two lines from the foundational code and adapted them to display as up and down arrows on the chart. The final and complete solution is to take these four lines of code and use them to replace the last two lines from our foundational code:
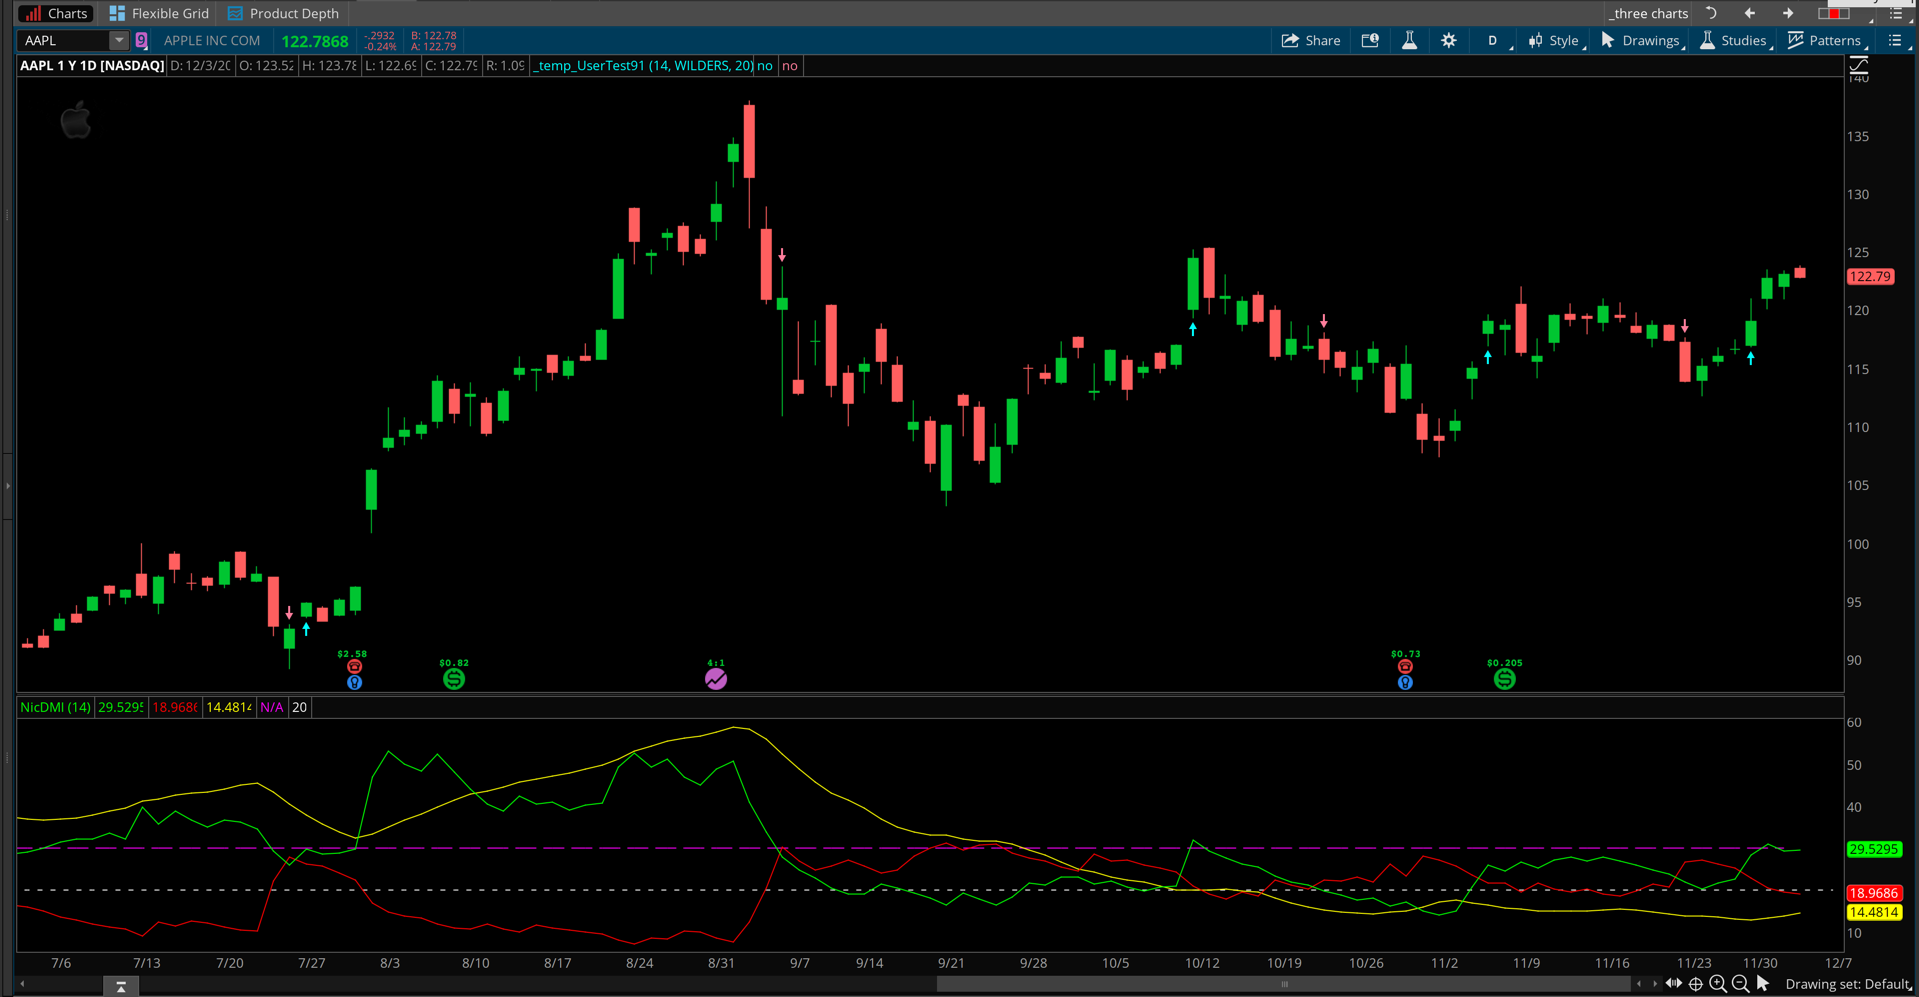
Screenshot below shows how this looks on the chart. Attachments:
Marked as spam
Answered on December 3, 2020 8:58 am
|