Plot range based on percent of previous day close


Category:
0
0

Hi Pete,

Thank you for all the hard work you do for us TOS users. I just have a quick question (hopefully). I would like to plot a range based on the previous days close and fill that range with color. As an example, there is a red area in the attached screenshot, which is a range of 150% – 200% from the previous close. This is all I have so far, but I know it’s wrong;

plot DailyClose = close(period=”DAY”)[1]*1.5;

Thanks so much!

-Davide

Attachments:
RESOLVED
Marked as spam
Posted by (Questions: 7, Answers: 12)
Asked on December 1, 2020 8:01 pm
52 views
0
Private answer

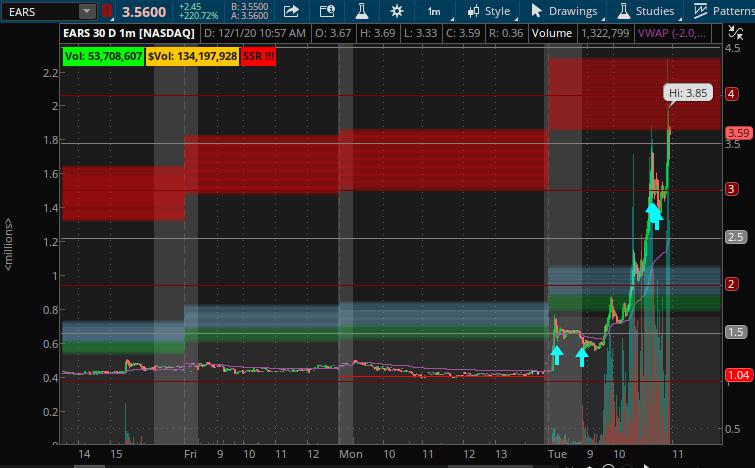
I can tell you the percent values used in the attached screenshot are much higher than 200% and 150%. I applied those values to the code and y0u can see from the screenshot I have attached below that the range is far from what you have specified.

It's also very important to note the shaded areas on the screenshot you provided are not the same size. Check that more closely and you will see for yourself. So your attempt to replicate this chart study you found is far from meeting the mark. The range that is shaded red on the screenshot you provided is being computed using an entirely different formula than you supposed.

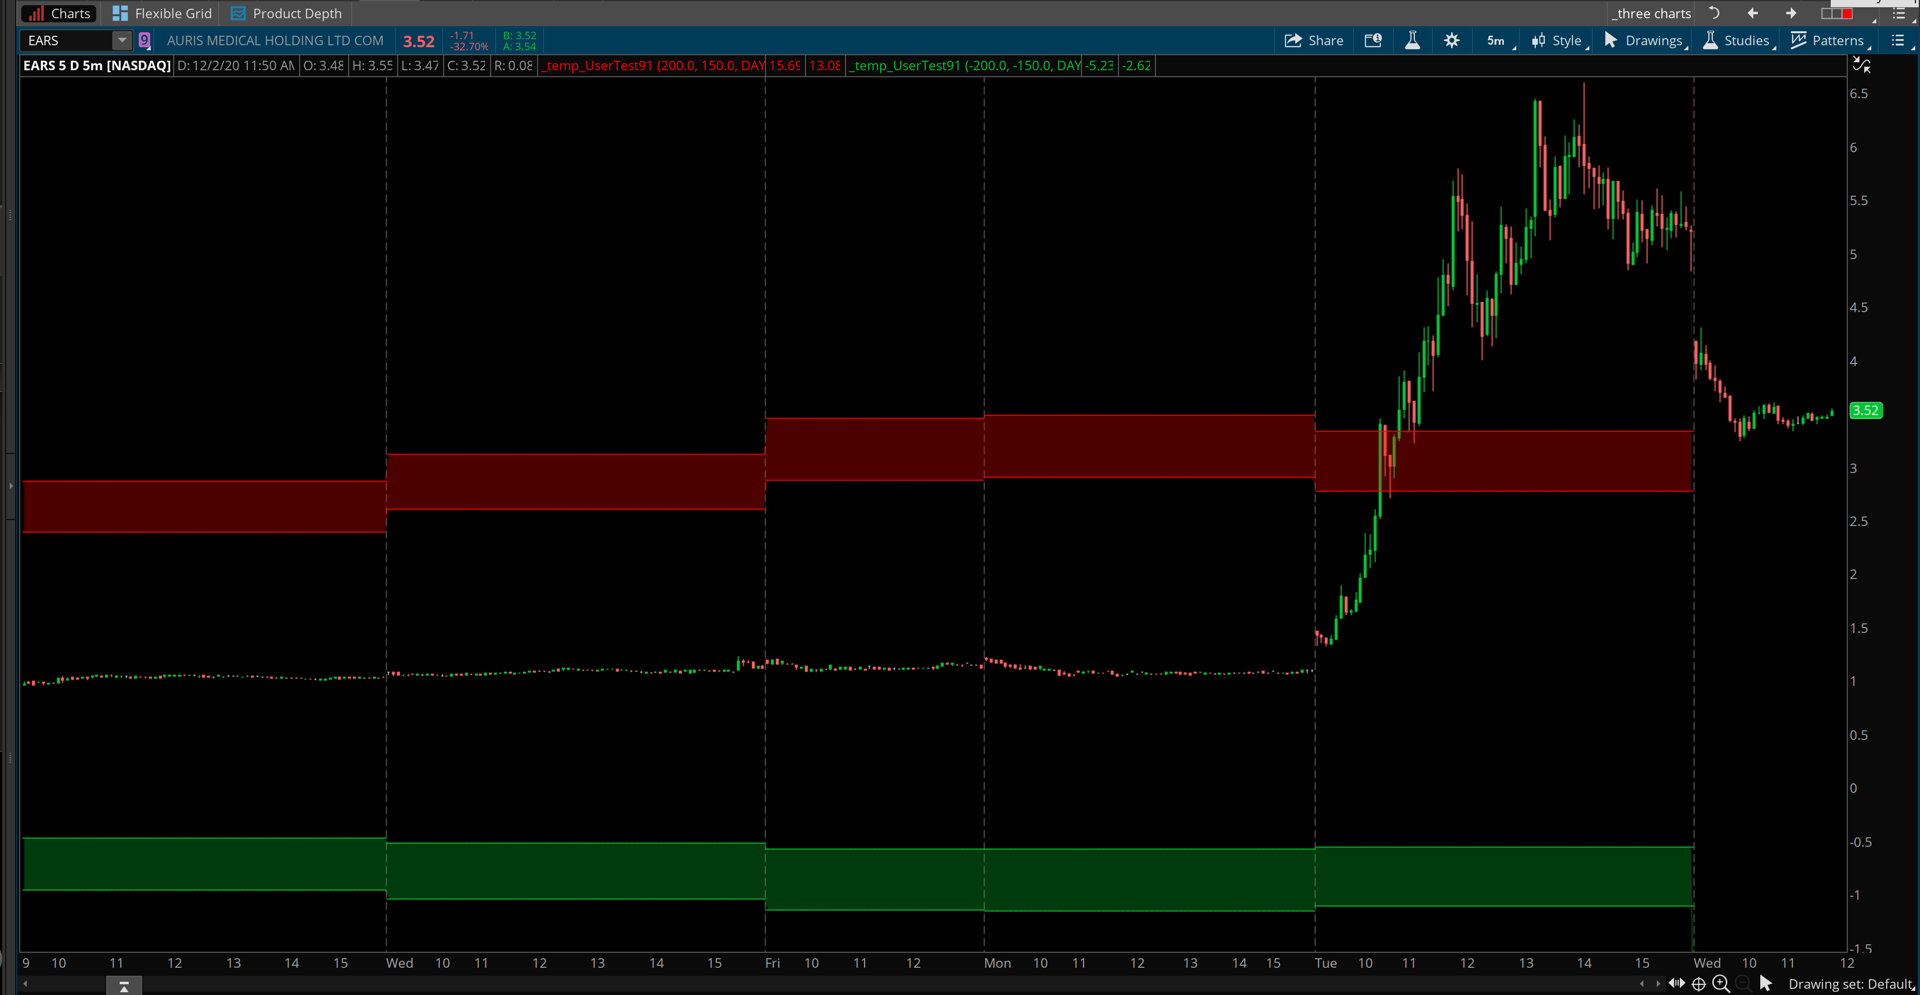
But here is the code that you have specified, even though it does not match the screenshot you provided as an example:

input percentThresholdTop = 200.0;
input percentThresholdBottom = 150.0;
input timeFrame = AggregationPeriod.DAY;
DefineGlobalColor("shading", Color.RED);
def previousDayClose = close(period = timeFrame)[1];
plot rangeTop = previousDayClose + (previousDayClose * percentThresholdTop * 0.01);
rangeTop.SetPaintingStrategy(PaintingStrategy.HORIZONTAL);
rangeTop.AssignValueColor(GlobalColor("shading"));
plot rangeBottom = previousDayClose + (previousDayClose * percentThresholdBottom * 0.01);
rangeBottom.SetPaintingStrategy(PaintingStrategy.HORIZONTAL);
rangeBottom.AssignValueColor(GlobalColor("shading"));
AddCloud(rangeTop, rangeBottom, GlobalColor("shading"), GlobalColor("shading"));

Attachments:
Marked as spam
Posted by (Questions: 37, Answers: 4087)
Answered on December 2, 2020 10:00 am
0
Wow, this is perfect, thank you!... There is just one closing parenthesis missing in your code above, last line.... other than that it works perfectly!
( at December 2, 2020 10:13 am)
0
Oh one last follow-up: If I just wanted the plot to show within pre-market (not during market hours), would that be an easy tweak to the code? Thanks!
( at December 2, 2020 10:30 am)
0
Sorry that would have to be incorporated into the code from the start. Details like that really need to be included up front. I only have about 15 min to provide each solution and we have already exceeded that for this solution.
( at December 2, 2020 1:20 pm)
0
No worries, I was just curious about that. Code works as intended, thanks so much for spending the extra time on it!
( at December 2, 2020 7:24 pm)