DMI Multi-Time Frame Indicator


Tags:
Category:
0
0

Hi Pete,
Can you create a multi-timeframe DMI Indicator that uses a Points painting strategy as opposed to lines, similar to the multi-timeframe MACD Indicator in the thinkscript code below.

The points should turn green when the DI+ is above the DI-

declare lower;
input timeFrameOne = AggregationPeriod.FIFTEEN_MIN;
input fastLength = 12;
input slowLength = 26;
input macdLength = 9;
input macdAverageType = AverageType.EXPONENTIAL;
def value = MovingAverage(macdAverageType, close(period = timeFrameOne), fastLength) – MovingAverage(macdAverageType, close(period = timeFrameOne), slowLength);
def average = MovingAverage(macdAverageType, value, macdLength);
plot rowOne = if !IsNaN(close) then 0 else Double.NaN;
rowOne.SetPaintingStrategy(PaintingStrategy.POINTS);
rowOne.AssignValueColor(if value > average then Color.GREEN else Color.RED);
rowOne.SetLineWeight(3);

RESOLVED
Marked as spam
Posted by (Questions: 4, Answers: 1)
Asked on July 4, 2022 5:25 pm
257 views
0
Private answer

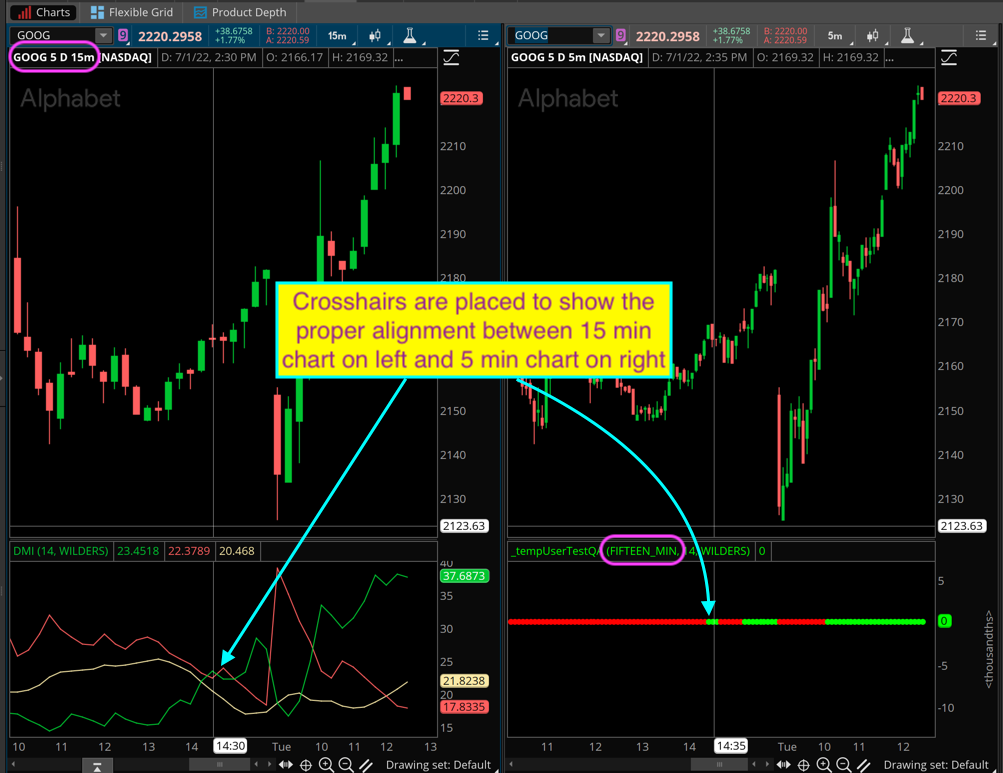
Thanks for providing all of the details required for the solution. And the fact that you provided your own functioning example allows me to complete this solution in within the brief 15 minutes I allocated to each free solution I provide in this forum.

For those looking for an advanced MTF MACD indicator and strategy for back-testing. I have published one which covers three time frames. You will find that located here on our website:

https://www.hahn-tech.com/thinkorswim-strategy-guide-mtf/

And I also published an article showing how to build a MTF MACD custom scan:

https://www.hahn-tech.com/thinkorswim-mtf-macd-scan/

Here is the code for MTF DMI dots. Screenshot below shows how this looks on the chart:

declare lower;
input timeFrameOne = AggregationPeriod.FIFTEEN_MIN;
input length = 14;
input averageType = AverageType.WILDERS;
def hiDiff = high(period = timeFrameOne) - high(period = timeFrameOne)[1];
def loDiff = low(period = timeFrameOne)[1] - low(period = timeFrameOne);
def plusDM = if hiDiff > loDiff and hiDiff > 0 then hiDiff else 0;
def minusDM = if loDiff > hiDiff and loDiff > 0 then loDiff else 0;
def atrValue = MovingAverage(averageType, TrueRange(high(period = timeFrameOne), close(period = timeFrameOne), low(period = timeFrameOne)), length);
def diPlus = 100 * MovingAverage(averageType, plusDM, length) / atrValue;
def diMinus = 100 * MovingAverage(averageType, minusDM, length) / atrValue;
plot rowOne = if !IsNaN(close) then 0 else Double.NaN;
rowOne.SetPaintingStrategy(PaintingStrategy.POINTS);
rowOne.AssignValueColor(if diPlus > diMinus then Color.GREEN else Color.RED);
rowOne.SetLineWeight(3);

Attachments:
Marked as spam
Posted by (Questions: 37, Answers: 4090)
Answered on July 5, 2022 9:42 am