Draw Text based on Current Volume as % of AvgVOL


Category:
0
0

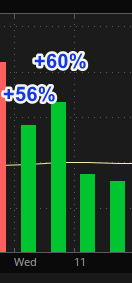
Hi Pete

I would like to create a chart study that will draw a text above Volume bars every time the value is above the VolumeAVG (input 50) and display % value. Please see attachment

Indicator used (VolumeAvg) with input 50
When Current Volume in 1Hour Timeframe >= VolumeAvg(50) , draw text in % value

Thank you

Attachments:
Marked as spam
Posted by (Questions: 12, Answers: 1)
Asked on November 8, 2020 6:19 am
71 views
0
Private answer

In Thinkorswim we cannot display text as you have shown on your screenshot. The only way to place text over specific bars on a lower subgraph is by using the "AddChartBubble()" statement. Full details here:

https://tlc.thinkorswim.com/center/reference/thinkScript/Functions/Look---Feel/AddChartBubble

Here is the code to place chart bubbles over the bars you have specified and display the percent difference between the volume and volume average:

declare on_volume;
input decimalsToRound = 1;
input length = 50;
plot Vol = volume;
plot VolAvg = Average(volume, length);
Vol.SetPaintingStrategy(PaintingStrategy.HISTOGRAM);
Vol.SetLineWeight(3);
Vol.DefineColor("Up", Color.UPTICK);
Vol.DefineColor("Down", Color.DOWNTICK);
Vol.AssignValueColor(if close > close[1] then Vol.color("Up") else if close < close[1] then Vol.color("Down") else GetColor(1)); VolAvg.SetDefaultColor(GetColor(8)); def percentChange = Round(100 * (volume / VolAvg - 1), decimalsToRound); AddChartBubble(volume > VolAvg, volume, Concat(percentChange, "%"), Color.WHITE);

Marked as spam
Posted by (Questions: 37, Answers: 4087)
Answered on November 8, 2020 8:53 am