Display the last 20 candles’ average size/length


Category:
0
0

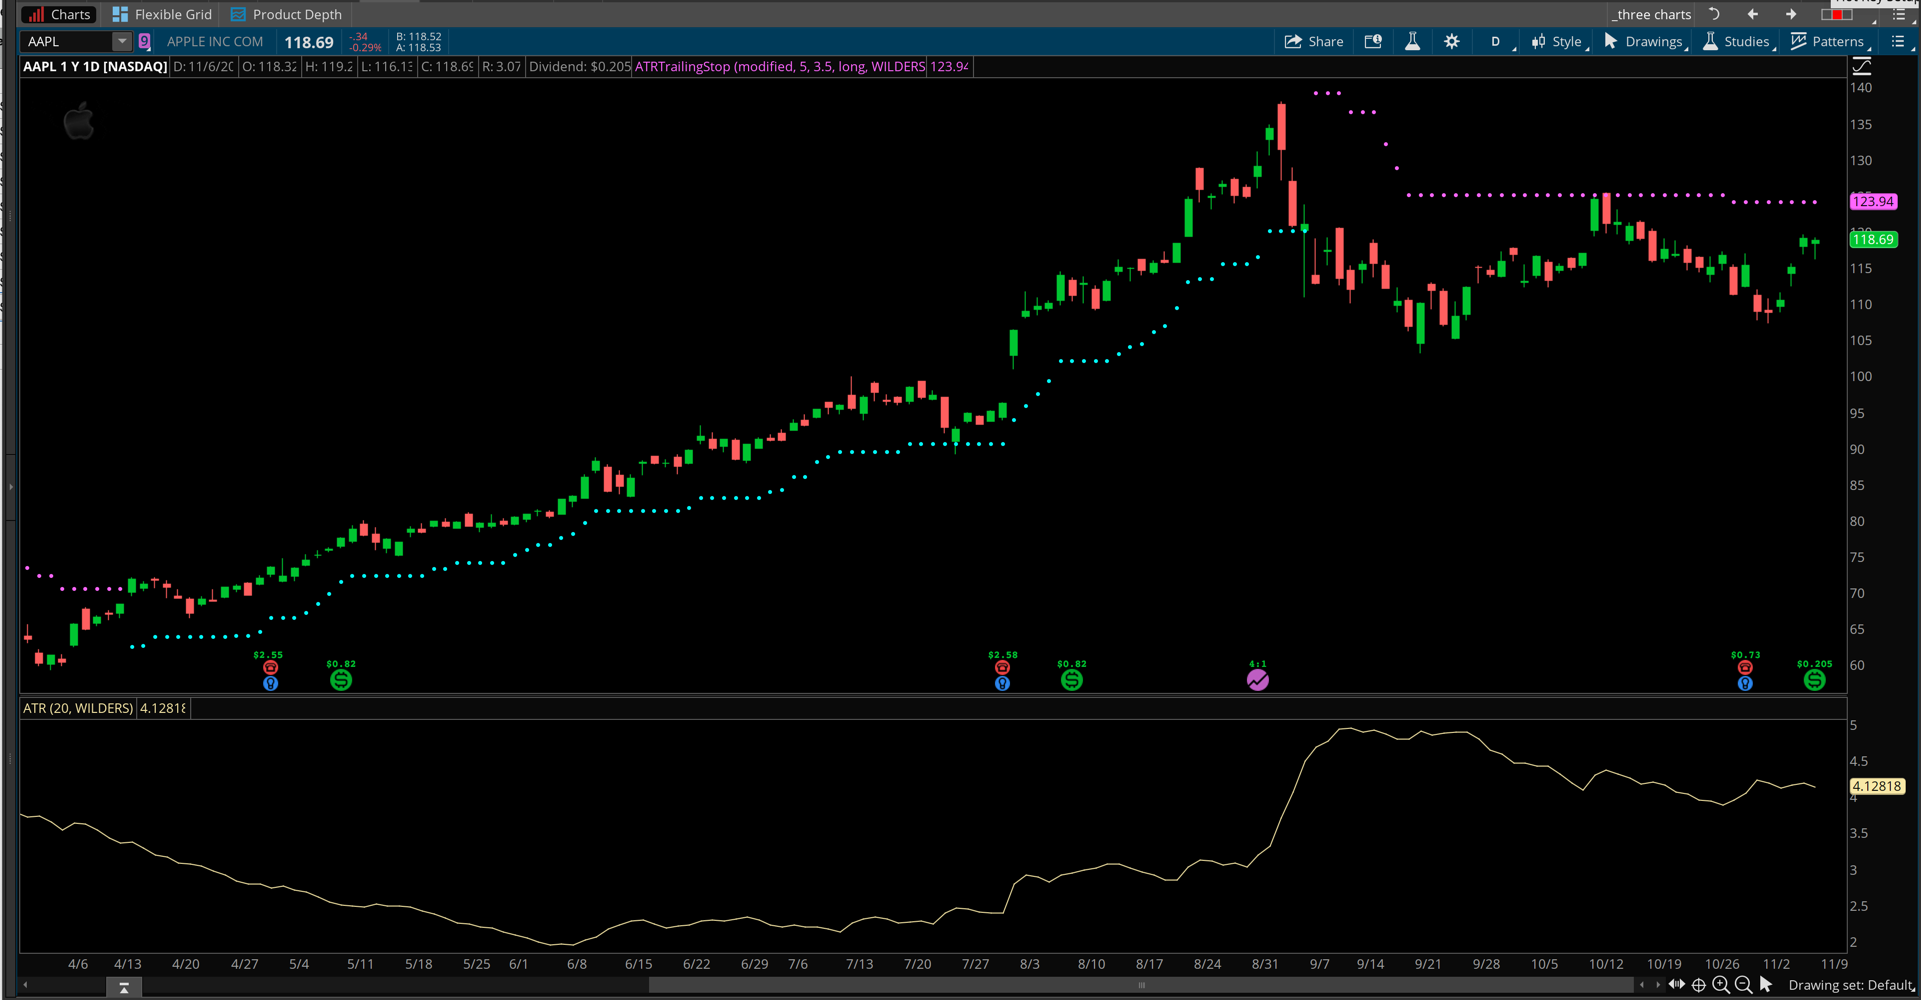
Hi Pete, can you pls write a script to display in the upper study chart the last 20 candles average size using High and Low price of each candles.

I am going to use it to set my trailing stop a little over of its average size value. It can either be percentage or dollar value or both.   Thank you.

Marked as spam
Posted by (Questions: 8, Answers: 2)
Asked on November 6, 2020 8:44 pm
187 views
0
Private answer

Every trading platform already has a built-in chart study that computes this value. It's named "ATR". Just change the default length from 14 to 20. This does not plot on the upper price chart. Because the values it computes are not on the same price range as the stock. So even if you tried to display it on the upper price graph it would not show up anywhere near the price candles on the chart.

If you are looking for a tool that serves as a trailing stop and uses the high-low range of each candle.... Well that tool already exists as well. On Thinkorswim it's named "ATRTRailingStop".

I have included a screenshot below that shows each of these two built-in chart studies added to a chart.

Attachments:
Marked as spam
Posted by (Questions: 37, Answers: 4087)
Answered on November 7, 2020 8:15 am