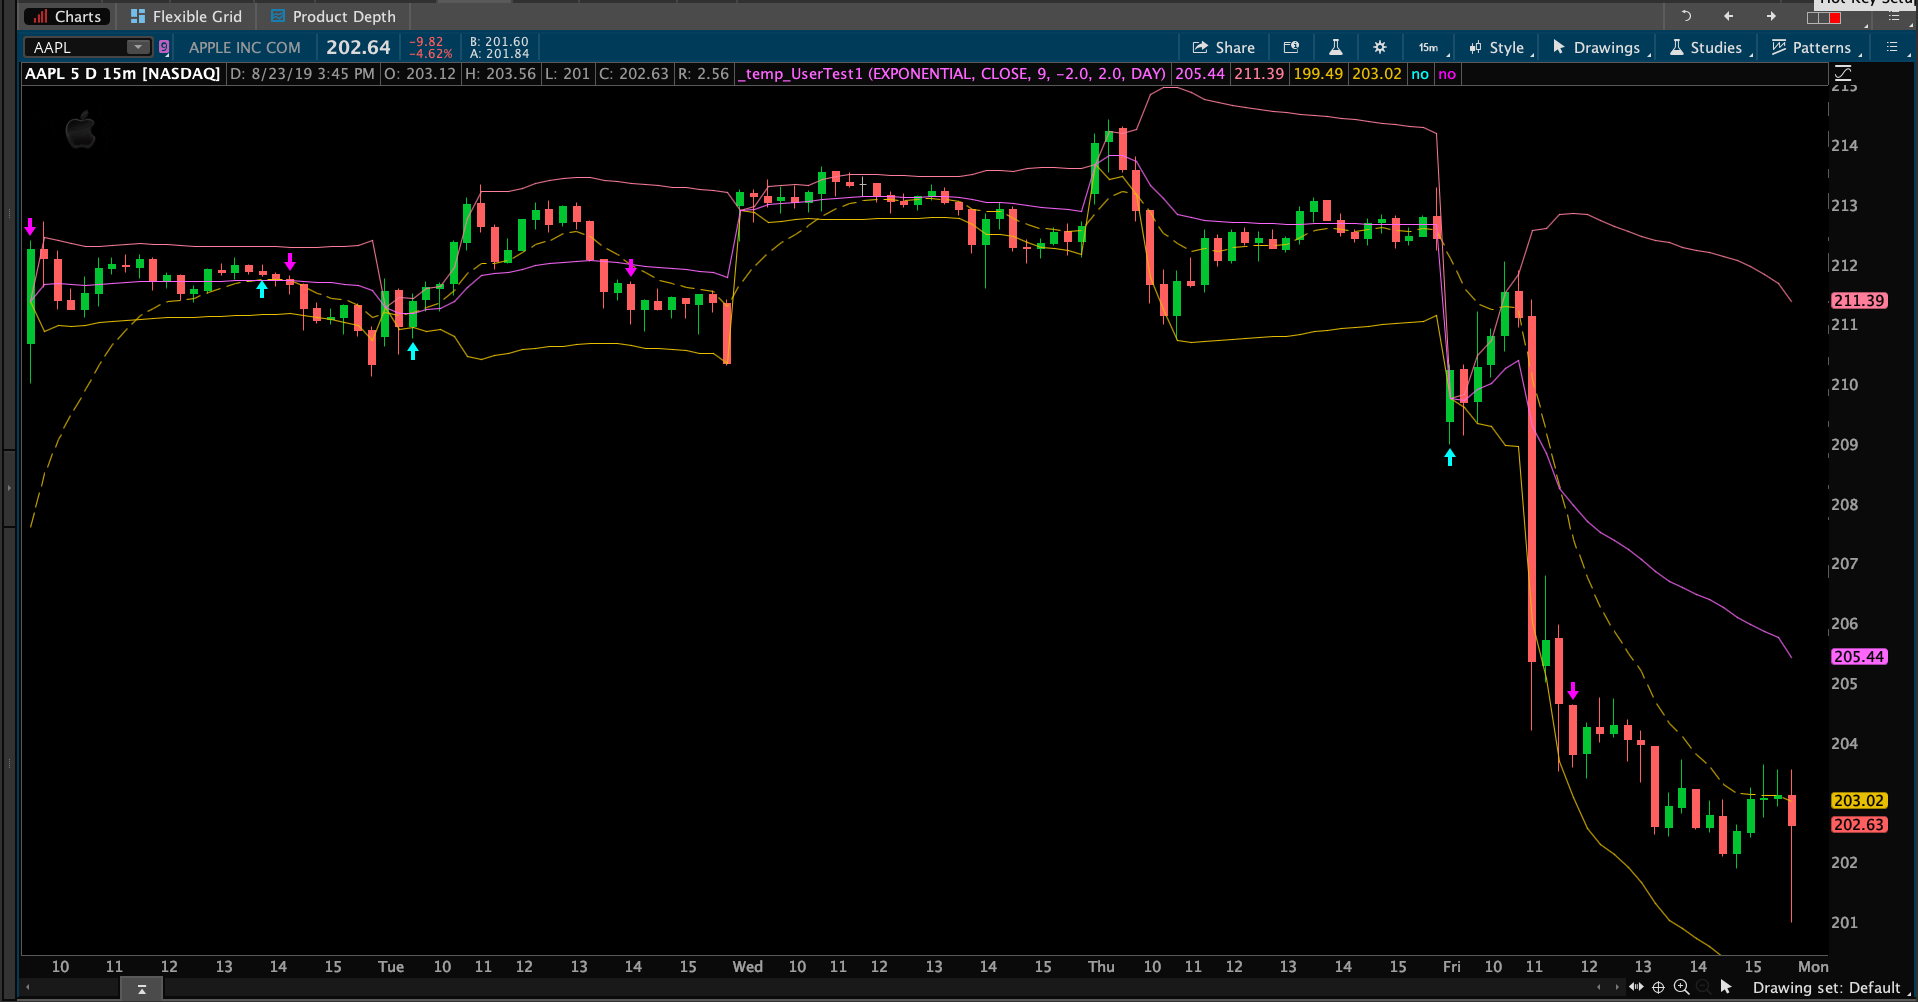
Here you go. You need to use the full code from the VWAP study. Not just 'vwap'. Screenshot below shows the result.
input maType = AverageType.EXPONENTIAL;

input maPrice = close;

input maLength = 9;

input numDevDn = -2.0;

input numDevUp = 2.0;

input timeFrame = {default DAY, WEEK, MONTH};

def cap = getAggregationPeriod();

def errorInAggregation =

timeFrame == timeFrame.DAY and cap >= AggregationPeriod.WEEK or

timeFrame == timeFrame.WEEK and cap >= AggregationPeriod.MONTH;

assert(!errorInAggregation, "timeFrame should be not less than current chart aggregation period");

def yyyyMmDd = getYyyyMmDd();

def periodIndx;

switch (timeFrame) {

case DAY:

periodIndx = yyyyMmDd;

case WEEK:

periodIndx = Floor((daysFromDate(first(yyyyMmDd)) + getDayOfWeek(first(yyyyMmDd))) / 7);

case MONTH:

periodIndx = roundDown(yyyyMmDd / 100, 0);

}

def isPeriodRolled = compoundValue(1, periodIndx != periodIndx[1], yes);

def volumeSum;

def volumeVwapSum;

def volumeVwap2Sum;

if (isPeriodRolled) {

volumeSum = volume;

volumeVwapSum = volume * vwap;

volumeVwap2Sum = volume * Sqr(vwap);

} else {

volumeSum = compoundValue(1, volumeSum[1] + volume, volume);

volumeVwapSum = compoundValue(1, volumeVwapSum[1] + volume * vwap, volume * vwap);

volumeVwap2Sum = compoundValue(1, volumeVwap2Sum[1] + volume * Sqr(vwap), volume * Sqr(vwap));

}

def price = volumeVwapSum / volumeSum;

def deviation = Sqrt(Max(volumeVwap2Sum / volumeSum - Sqr(price), 0));

plot VWAP = price;

plot UpperBand = price + numDevUp * deviation;

plot LowerBand = price + numDevDn * deviation;

VWAP.setDefaultColor(getColor(0));

UpperBand.setDefaultColor(getColor(2));

LowerBand.setDefaultColor(getColor(4));

plot ma = MovingAverage(maType, maPrice, maLength);

ma.SetStyle(Curve.MEDIUM_DASH);

plot crossAbove = ma[1] < VWAP[1] and ma > VWAP;

crossAbove.SetPaintingStrategy(PaintingStrategy.BOOLEAN_ARROW_UP);

crossAbove.SetLineWeight(3);

crossAbove.SetDefaultColor(Color.CYAN);

plot crossBelow = ma[1] > VWAP[1] and ma < VWAP;

crossBelow.SetPaintingStrategy(PaintingStrategy.BOOLEAN_ARROW_DOWN);

crossBelow.SetLineWeight(3);

crossBelow.SetDefaultColor(Color.MAGENTA);