| ♥ 0 |
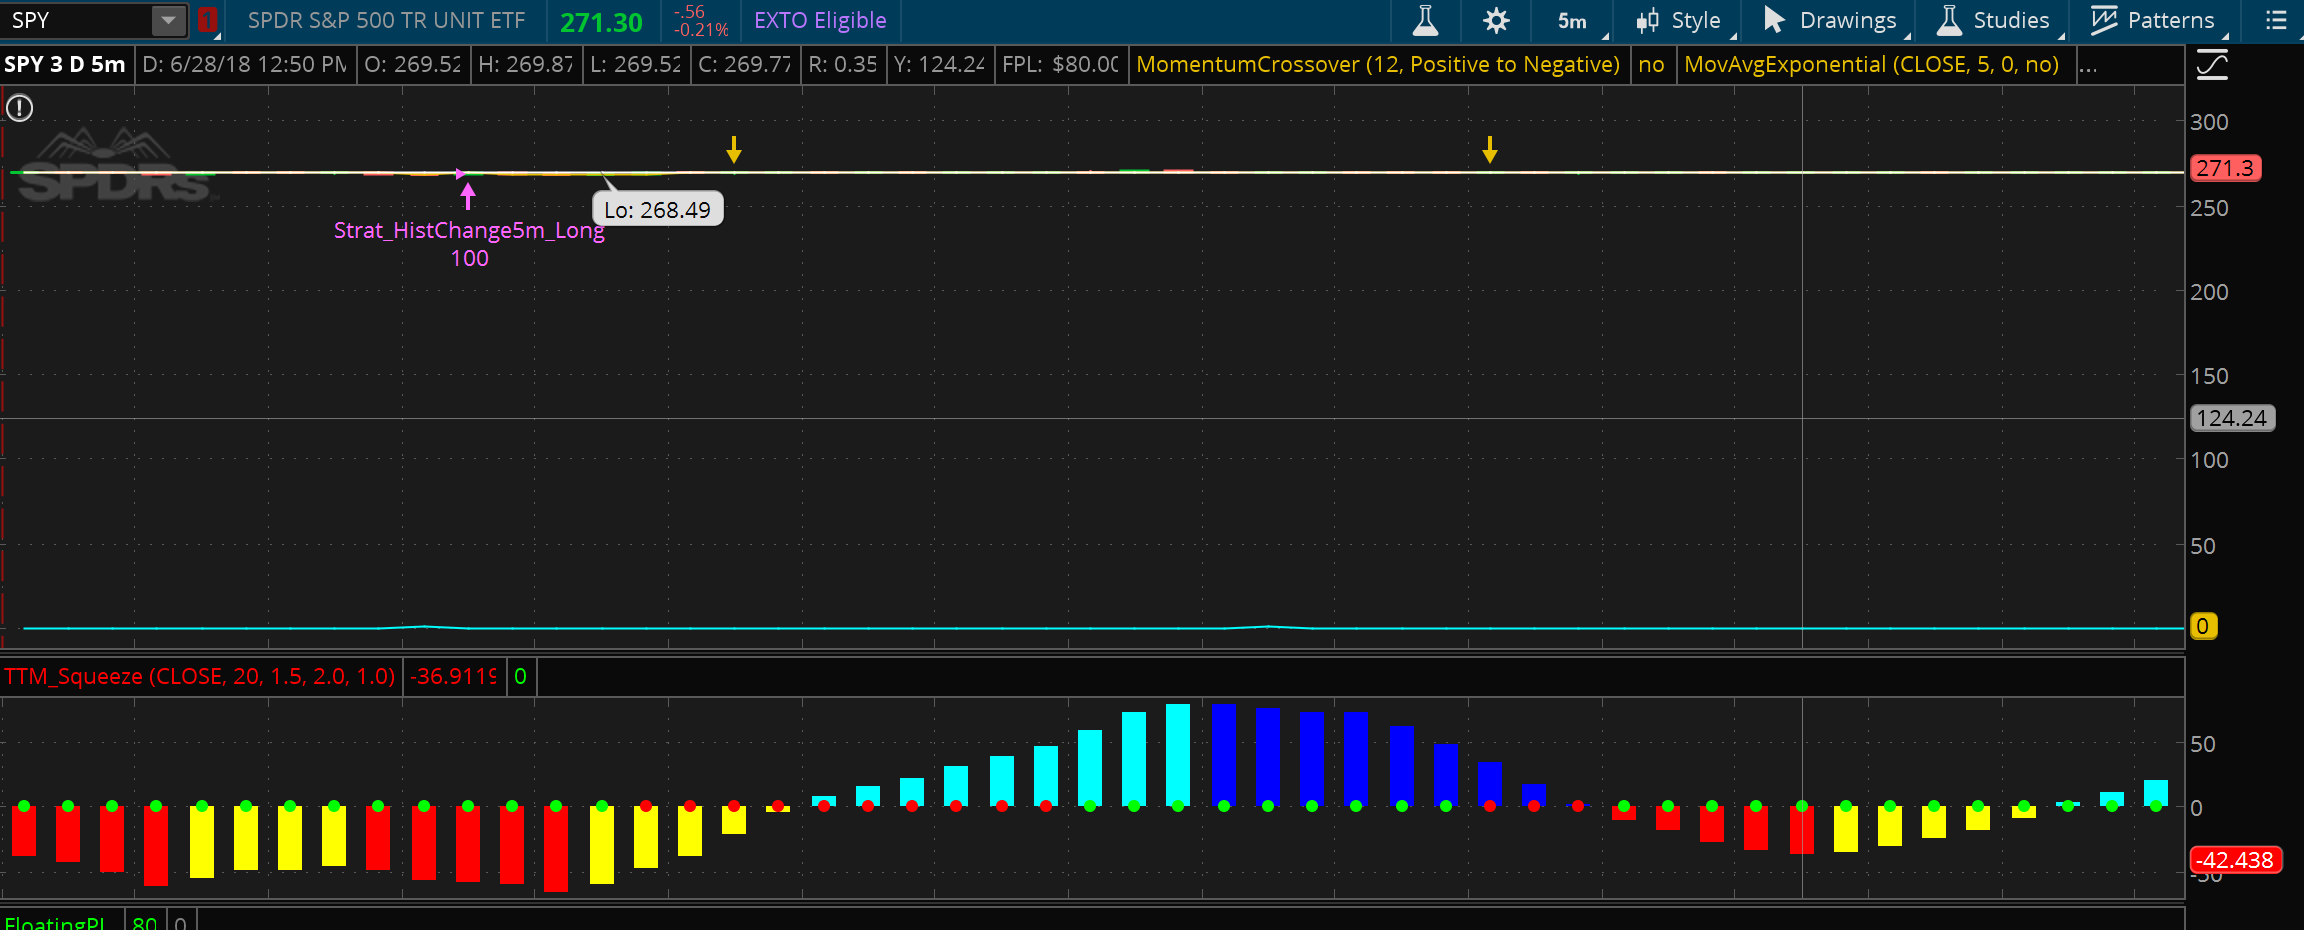
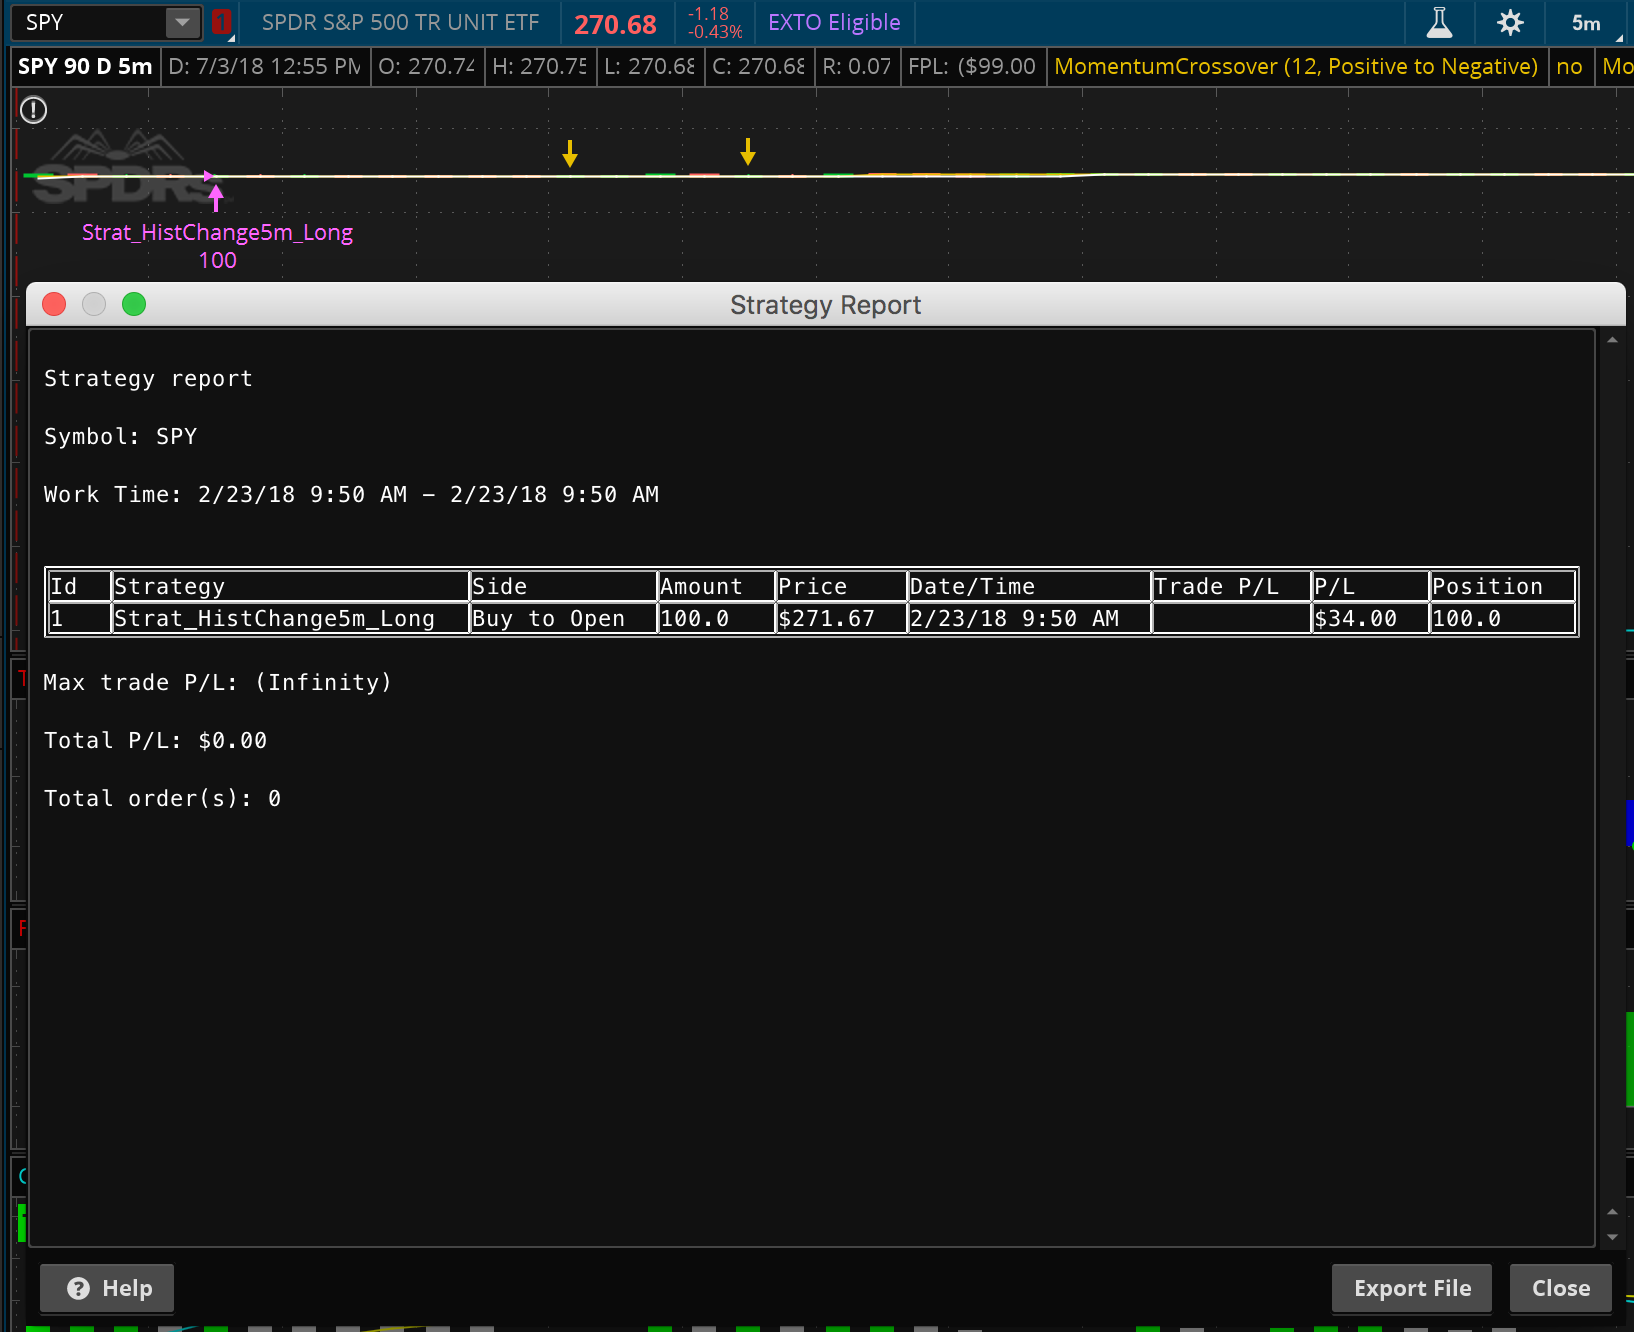
Hi Pete, I converted the Squeeze Scanner provided by you into a strategy after watching both the Strategy guide videos. I downloaded and analysed the readymade strategies you provided, and they worked fine. However, the Squeeze scanner turns the chart into one flat line when I apply it. When i uncheck ‘Show Study’ within the strategy settings, the chart returns to normal. Attached screenshots show my chart when i apply the scanner and when i turn it off. I am wondering if the strategy itself is running properly because when I pull up a report, it only shows one trade, over a 90 day period. Which is unlikely. Following is the code within the strategy’s thinkscript:
input price = CLOSE; plot scan; def squeezeHistogram = TTM_Squeeze(price, length, nK, nBB, alertLine).Histogram; def momentumPivotLow = (squeezeHistogram > squeezeHistogram[1] and squeezeHistogram[1] < squeezeHistogram[2]) ; def momentumPivotHigh = (squeezeHistogram < squeezeHistogram[1] and squeezeHistogram[1] > squeezeHistogram[2]); #plot barsSincePivot = GetMaxValueOffset(momentumPivot); def pivotLowFollowThrough = (momentumPivotLow[1] and squeezeHistogram > squeezeHistogram[1]); def pivotHighFollowThrough = (momentumPivotHigh[1] and squeezeHistogram < squeezeHistogram[1]); def zeroLinePositiveFollowThrough = ( squeezeHistogram > 0 and squeezeHistogram[1] > 0 and squeezeHistogram[2] < 0 ) ; def zeroLineNegativeFollowThrough = (squeezeHistogram < 0 and squeezeHistogram[1] < 0 and squeezeHistogram[2] > 0); # uncomment one to scan for zero line positive/negative with follow through bar AddOrder(OrderType.BUY_AUTO, scan[0], open[-1], tickcolor = GetColor(0), arrowcolor = GetColor(0)); Also, have you covered anywhere on the website how to write the code for an exit strategy? I ran another strategy, that was the MTF_MACD_LE and it was using the exit signal of Strat_PivotRev_SlowDRev. Can you help me with the code if i want my exit signal for the strategy defined as such: Whichever of the below two occurs first. a) two consecutive red bars. b) Bearish engulfing.
Thanks once again! I greatly value all your help. Attachments:
Marked as spam
Asked on July 3, 2018 10:04 am
322 views
|
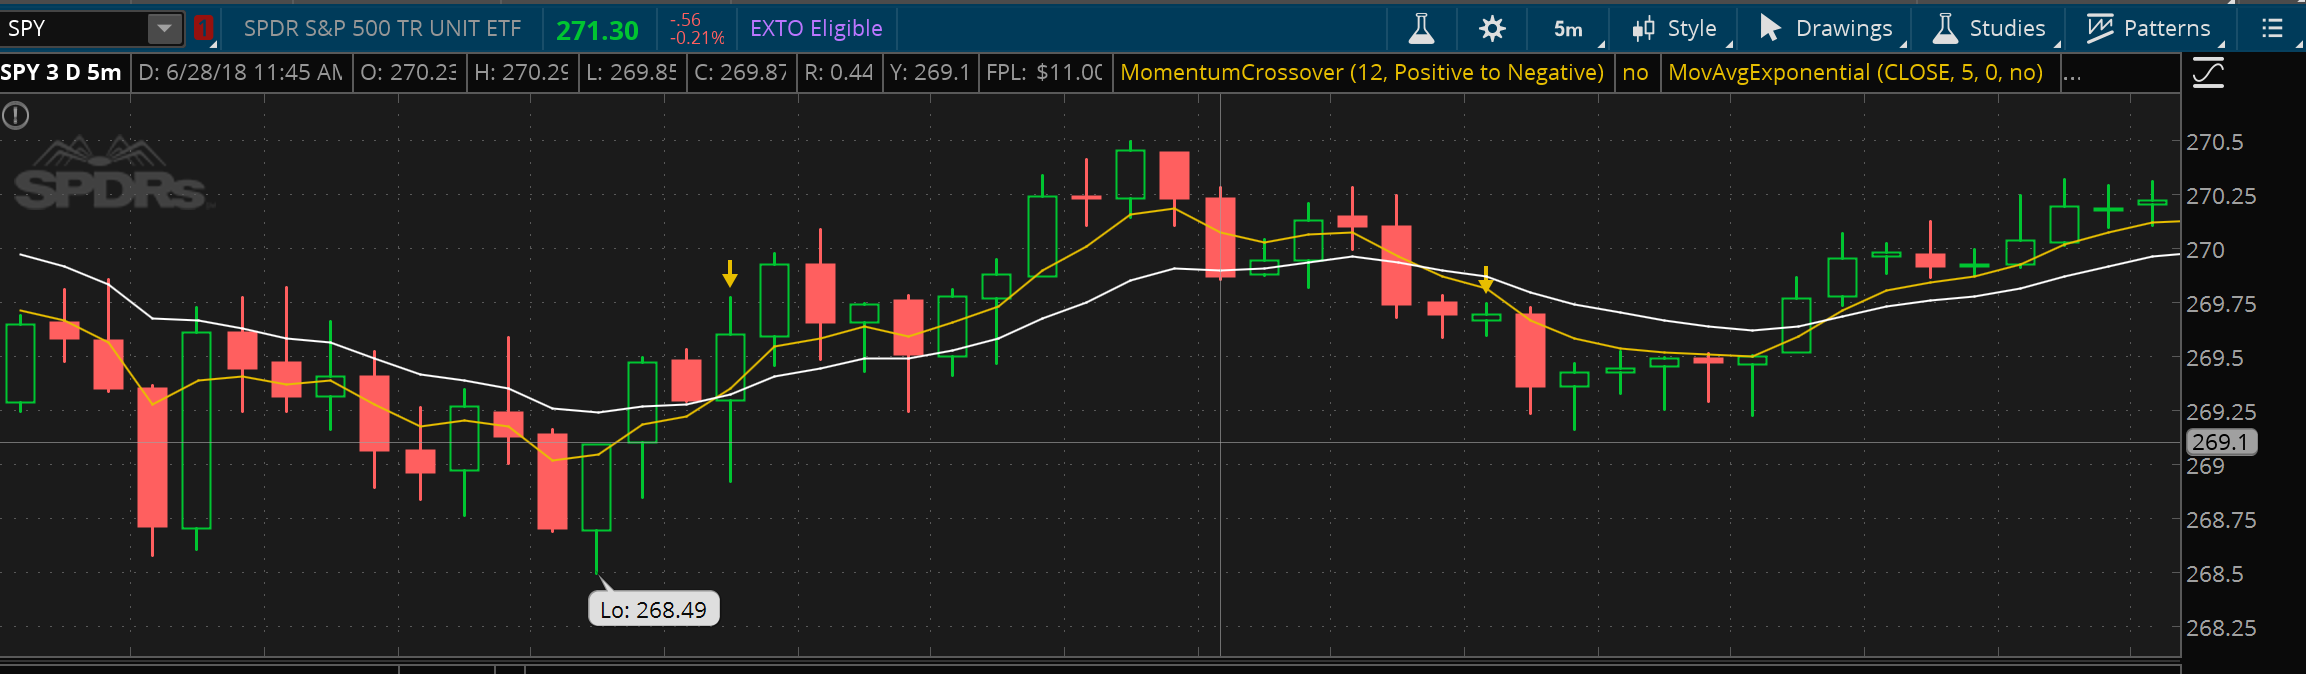
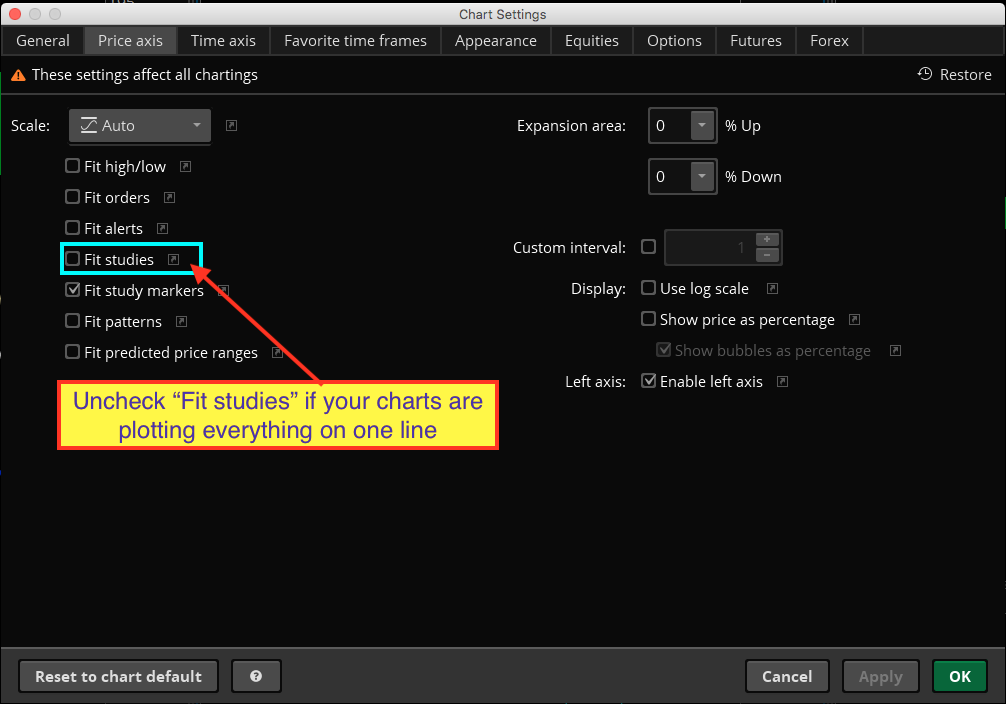
Thanks. I unchecked Fit Studies and my chart has returned to its normal appearance. However, I cannot see the strategy working anymore. It is not plotting any data on the chart. Although, i can see with the histogram indicator that there are plenty of points where it should. I just watched the video again where you converted the scan into strategy and i can’t seem to find what i am doing wrong. The codes are exactly as they were when i posted the question.
Regarding exit strategy. Yes, I meant the way you have a Long Entry and a Long Exit signal combined within one strategy, i wanted a Long Exit for the Squeeze Histogram strategy, so i could get Buy and Sell signals in one chart with one strategy turned on.
By bearish engulfing i mean, when a green candle is followed by a red candle where the red candle engulfs the preceding green candle completely.
Regarding: “I cannot see the strategy working anymore. It is not plotting any data on the chart.”. You need to have sell orders in addition to buy orders. The strategy you created only contains entry orders. So it plots one entry and then waits for an exit signal. None is given. Add any built-in strategy that ends with “LX” and you will get a full set of theoretical buys and sells.
Have you already viewed the first two videos in this series? You may have skipped to an advanced video without having laid a strong foundation first. These strategies are very advanced tools.
First video: https://www.hahn-tech.com/thinkorswim-strategy-guide/
Second video: https://www.hahn-tech.com/thinkorswim-strategy-analysis/
Yes, I did view the initial videos and they were very helpful. I had no knowledge about coding initially and whatever I have learnt is entirely through your videos. You explained it in a simple manner so I felt confident enough to give them a try working with them myself. However, just got stuck with this bit or would have been good to go.
I took a look at the LX strategies in ToS and they aren’t exactly as I’d like them to be. I also tried mucking around creating one myself, but the results are all haywire. Can you write one for me based on the two conditions i mentioned above, if it’s not too much of an ask.
Thanks a ton again.
Ok, good. So we already have one of those two exit conditions, posted at the end of my original answer:
def twoRedBars = close < open and close[1] < open[1];
The bearish engulfing is still unclear: "where the red candle engulfs the preceding green candle completely" Some will say this means only the high of the engulfing bar needs to be above the high of the previous bar.
def bearEngulfingOne = close < open and close < low[1] and high > high[1];
Others will say the open of the engulfing bar needs to be above the high of the previous bar.
def bearEngulfingTwo = close < open and close < low[1] and open > high[1];
So pick one. This will give you the two conditions you need for your sell exit order statement.
Last thought, have you checked the last video in the series? Thinkorswim AutoTrade Almost? That one shows how to build strategies using the condition wizard.
Excellent, thanks a lot.
Just one last silly question. Where exactly do I need to put the code in the script? Once I understand that, i’ll be able to understand the logic behind the scripts.
And no, I have not seen that video. I will watch it later today. I intend to watch all your ToS related content – as there’s a wealth of information in them all. I am trying all the different strategies you have offered, and converting my ideas too, to see which works best. I’ll surely stick around on your website for a long time to come. Great work, and thank you again!
You just add them to the bottom of the code you already have. So we have two lines to add for the two conditions you asked for. Then we have a third line to add for the sell order.
def twoRedBars = close < open and close[1] < open[1];
def bearEngulfingOne = close < open and close < low[1] and high > high[1];
AddOrder(OrderType.SELL_TO_CLOSE, twoRedBars or bearEngulfingOne, open[-1], tickcolor = GetColor(0), arrowcolor = GetColor(0));
Thank you so much. I can go a long way with this.