Analyzing Theoretical Performance Output from Strategies in Thinkorswim
Thinkorswim Strategy Analysis
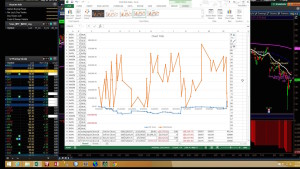
So you know how to use the Strategies tool in the Thinkorswim platform. But do you know how to export the strategy data and create a “P/L Curve” and “Equity at Work” plots on a graph? Do you think you can do this for multiple stocks and plot all the trade data on the same graph? In this video you will learn how to export your strategy data into Excel. You will then see an easy to follow step-by-step process of combining strategy data from multiple stock symbols into a single data set. After adding a few extra columns to calculate your P/L Curve and Equity at Work it’s just a few clicks to get them plotted on a graph inside an Excel spreadsheet.
Here is a link to the spreadsheet used in the video: Strat Stats Video.xlsx
For Excel users of average experience this should be an easy task. For those new to spreadsheets it may present some challenges. A special blog post has been setup to provide support and solutions to those who run into issues. Here is the link: TOS Strategy Analysis . Please be sure to check this article for tips and solutions. Post any questions or issues you have in the comments section of the article linked above and they will be addressed as soon as possible.
For Advanced Users Only:
Take this knowledge to the next level and learn how to automate your trades on Thinkorswim
Thinkorswim Automated Round-Trip Trades
DISCLAIMER: I AM NOT A CERTIFIED FINANCIAL ADVISOR AND NOTHING IN THIS VIDEO OR TEXT IS AN ADVERTISEMENT OR RECOMMENDATION TO BUY OR SELL ANY FINANCIAL INSTRUMENT. NOR IS THIS VIDEO OR TEXT INTENDED TO INSTRUCT YOU ON HOW TO MAKE BUY OR SELL DECISIONS USING ANY OF THESE INDICATORS.
*Thinkorswim is a chart analysis platform offered by Charles Schwab: https://www.schwab.com/
Charles Schwab provides financial services including the trading of Stocks, Futures, Options and Forex.
Please be sure to share this page with your friends and colleagues. Leaving comments below is the best way to help make the content of this site even better.
I’m not sure why you need to open the downloaded html results in a web browser and then copy and paste to an excel spreadsheet. Excel can import an html file directly. The same is sort of true for the csv file as well providing that you import it using the data tab/text file(CSV). The TOS file is delimited with semicolons which is why just opening the file directly from excel using .txt extension doesn’t preserve the columns. In both cases the column widths and cell formatting are correct with no adjustments and the extra summary and identification information is also included.
Also I’d be interested in a detailed video on how to use the different order types for the strategies.
Thanks Mike. Your comments are appreciated. After publishing the video I submitted a request to thinkorswim support asking them to fix their output. Looks like it’s working much better than it did when the video was recorded.
The order types are pretty straight forward. You have a buy auto and sell auto. Those will post a theoretical order to open or close. If you want to restrict your orders so they can only open or close an order, use the other order types.
In the Cumulative Equity column, my spreadsheet doesn’t end in 0 (video around 27:00) because several of the Reports concluded with a Buy rather than a Sell, so they still have open trades. I tried eliminating the last Buy in one of the stocks, but that caused a #Ref error in the rest of the Cumulative Equity column. Is there a way to eliminate this situation without starting over and eliminating the last Buy entry for each of the stocks?
You have to clean up those last open buy orders before doing anything with the formulas. If you get #REF errors when deleting a row, try copying the formulas from the row above that point. Should fix it. But you will actually need to copy formulas from the top row down to the last row in order to make sure everything you built stays in alignment.
What is the formula for the Date Column? I can not see it on fullscreen? =left(celladdress)? Given at 15.30 in video. I downloaded the spreadsheet , but I do not see the formula in that column either. I might just do it on Lotus which I am much more familiar with.
I just reviewed that section of the video and the entire formula is clearly visible through the 16:27 mark. If you cannot see that part of the screen you are missing a large portion of the viewable area of the video. I suggest you try viewing the video on another device. The formula in cell K2 is =left(G2,len(G2)-2)