Your use of the term "repaint" is probably getting you stuck in the weeds. In the world of chart studies, the term "repaint" is used to describe a signal that changes as new bars are added to the chart. Future data, changes the signals that were previously displayed on the chart.
What you actually require here is to "extend" the last values all the way to the right. So I have updated the title of your question to reflect that. The new question title will make it very easy for anyone else seeking this solution to quickly find your post using the search function.
The way your code is designed, the very last value of your plots are shifted one bar to the right. Those lines are continually recalculated each time the price changes on the last bar of the chart. I thought I would point that out for your own benefit as well as the rest of our viewers who will come across this solution. To summarize, the lines are extended, but they are not static.
The method required to extend these plots to the right is by using recursive variables. When I use recursive variables I always use the "rec" definition in place of the "def". This makes the code easier to read and helps me identify recursive variables immediately while reviewing the code.
Here is the updated version that plots only the last value of the lines and extends them into the right-hand expansion area of the chart:
input length = 14;

input averageType = AverageType.WILDERS;

def atr = MovingAverage(averageType, TrueRange(high[1], close[1], low[1]), length);

def lastBarAndBeyond = !IsNaN(atr) and IsNaN(atr[-1]);

rec lastBarHigh = if lastBarAndBeyond then close[1] + atr else lastBarHigh[1];

rec lastBarLow = if lastBarAndBeyond then close[1] – atr else lastBarLow[1];

plot hatr = lastBarHigh;

plot latr = lastBarLow;

hatr.SetDefaultColor(color = Color.DARK_RED);

hatr.SetPaintingStrategy(PaintingStrategy.HORIZONTAL);

latr.SetDefaultColor(color = Color.DARK_GREEN);

latr.SetPaintingStrategy(PaintingStrategy.HORIZONTAL);
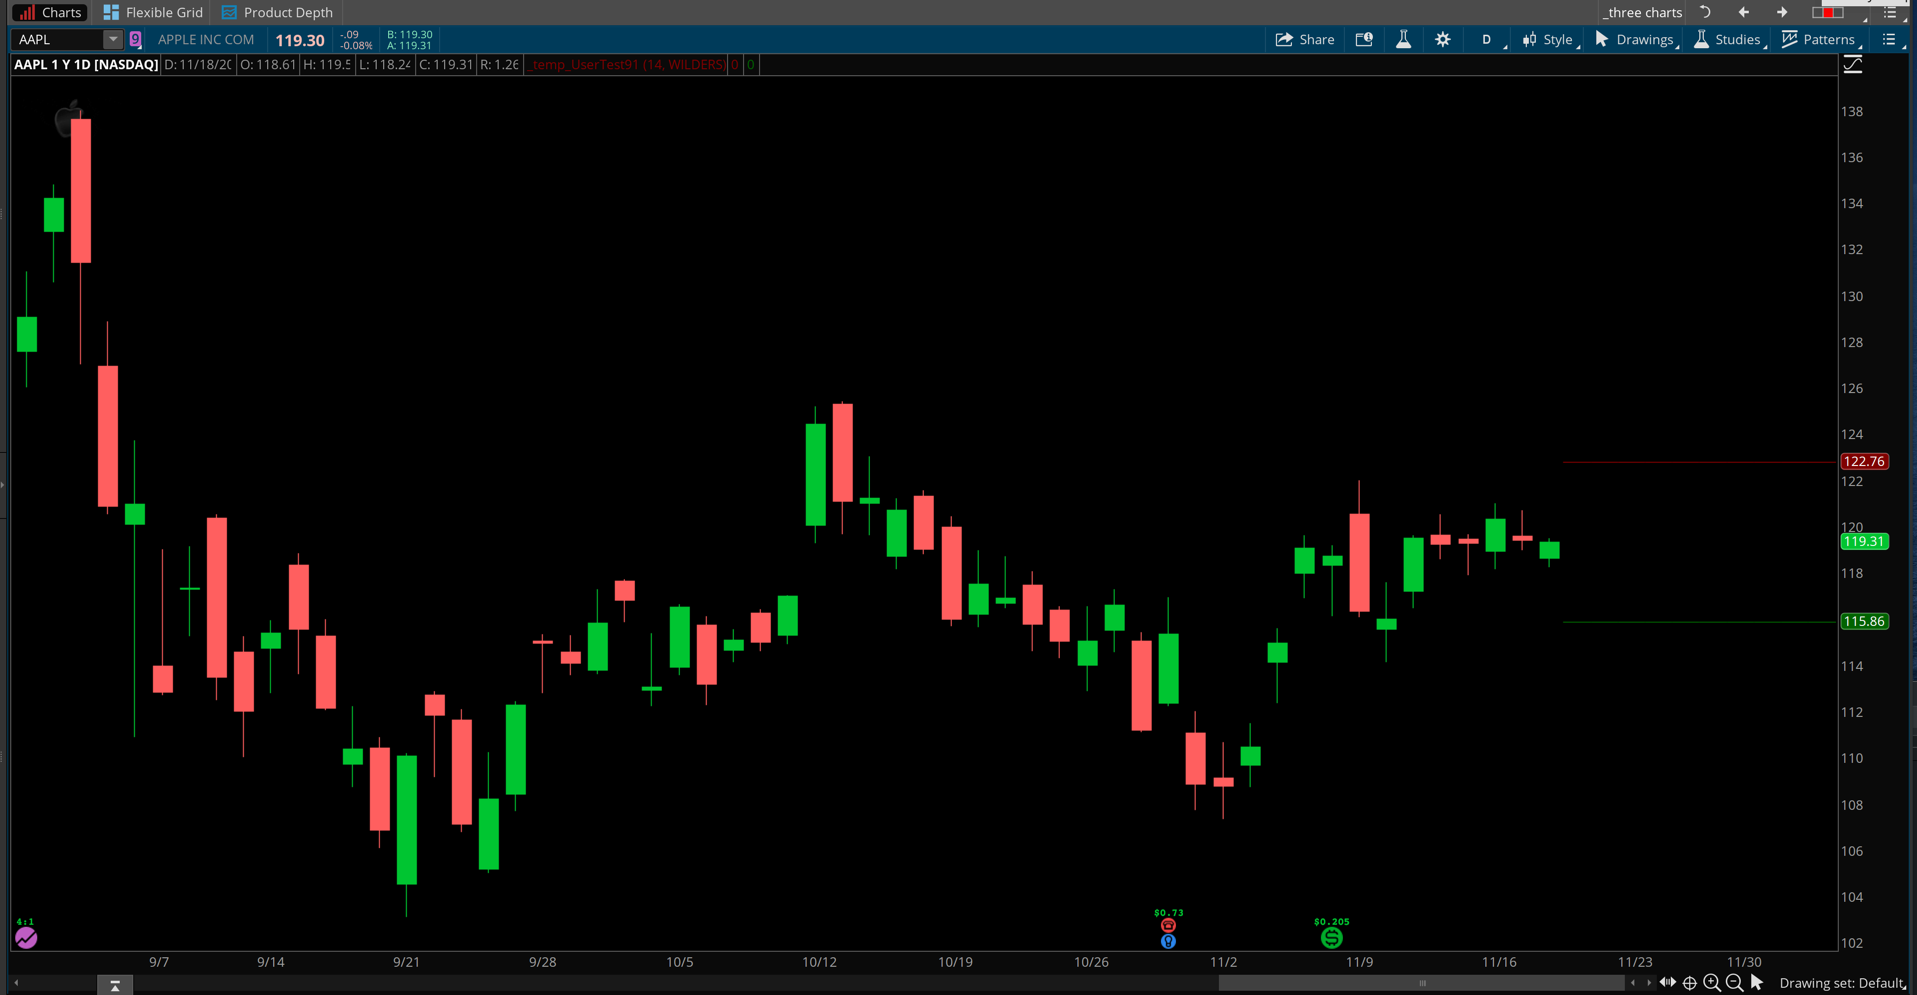
Screenshot is included below to show what this looks like.
Edit: After posting my solution the request was clarified to plot the last static value of these two lines rather than the one computed from the active bar. The solution is pretty simple and just requires adjustments to the following two lines from my solution above:
rec lastBarHigh = if lastBarAndBeyond[-1] then close[1] + atr else lastBarHigh[1];

rec lastBarLow = if lastBarAndBeyond[-1] then close[1] – atr else lastBarLow[1];