Extend horizontal line across high few days ahead and backward


Category:
0
0

Hello,
I am a newbie in thinkscript.  I started to work on a study in TOS to see how charts behave around Daily High. So I plotted the daily high on intraday chart. Then I decided to extend it to next 10 days. I tried to do it in a smart way using a short code using parameters. But could not do it. Therefore I just repeated 10 blocks of the same code. It worked for me for some time, but it is very laborious to make any change if I want to change the number of days etc.

Here is what I am trying to do,

1. I want the ability to extend the high to X number of days back and Y number of days forward. Both x and y should be the parameter(settings) values.

2. It should have ability to plot it both on Daily as well as intraday charts. If this choice is in settings, much better.

3. I want to have ability to plot horizontal lines across high only if the daily bar is a UP. Is it possible to make such a parameter, wher I can choose a either up or down bar.

Can any expert on this forum please guide me in this? I know you guys are super busy. But if you could find some time and help me, I will be obliged. It is very interesing study and I am really very excited to learn more about it. But it becomes frustrating when I try hard and yet can not do it. I am pasting my code below, which is obviously a bad code. 🙂

plot linehigh1 = high(period = “day” )[1];
     linehigh1.SetPaintingStrategy(PaintingStrategy.HORIZONTAL);
     linehigh1.SetDefaultColor(Color.VIOLET);
plot linehigh2 = high(period = “day” )[2];
     linehigh2.SetPaintingStrategy(PaintingStrategy.HORIZONTAL);
     linehigh2.SetDefaultColor(Color.VIOLET);
plot linehigh3 = high(period = “day” )[3];
     linehigh3.SetPaintingStrategy(PaintingStrategy.HORIZONTAL);
     linehigh3.SetDefaultColor(Color.VIOLET);
plot linehigh4 = high(period = “day” )[4];
     linehigh4.SetPaintingStrategy(PaintingStrategy.HORIZONTAL);
     linehigh4.SetDefaultColor(Color.VIOLET);
plot linehigh5 = high(period = “day” )[5];
     linehigh5.SetPaintingStrategy(PaintingStrategy.HORIZONTAL);
     linehigh5.SetDefaultColor(Color.VIOLET);
plot linehigh6 = high(period = “day” )[6];
     linehigh6.SetPaintingStrategy(PaintingStrategy.HORIZONTAL);
     linehigh6.SetDefaultColor(Color.VIOLET);
plot linehigh7 = high(period = “day” )[7];
     linehigh7.SetPaintingStrategy(PaintingStrategy.HORIZONTAL);
     linehigh7.SetDefaultColor(Color.VIOLET);
plot linehigh8 = high(period = “day” )[8];
     linehigh8.SetPaintingStrategy(PaintingStrategy.HORIZONTAL);
     linehigh8.SetDefaultColor(Color.VIOLET);
plot linehigh9 = high(period = “day” )[9];
     linehigh9.SetPaintingStrategy(PaintingStrategy.HORIZONTAL);
     linehigh9.SetDefaultColor(Color.VIOLET);
plot linehigh10 = high(period = “day” )[10];
     linehigh10.SetPaintingStrategy(PaintingStrategy.HORIZONTAL);
     linehigh10.SetDefaultColor(Color.VIOLET);

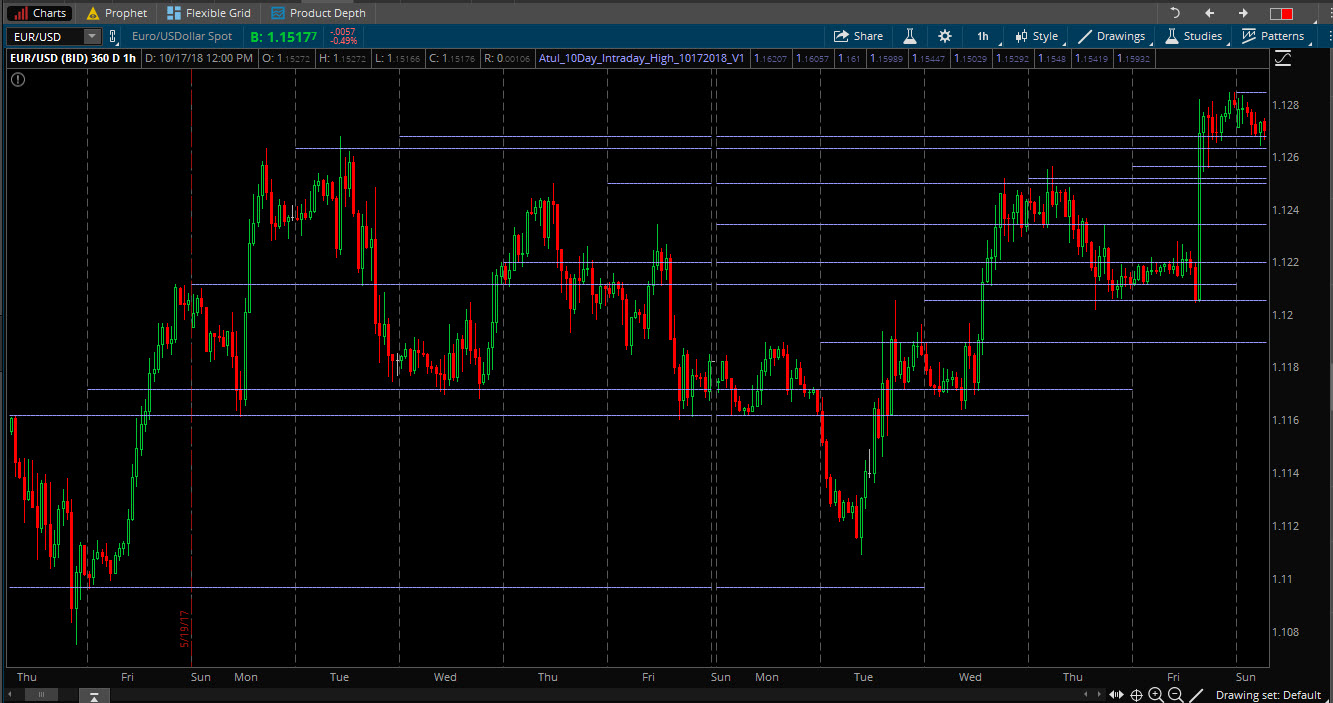
Here is the screen shot to show how it looks on the chart.

I request you to please help. Thanks in advance.

Attachments:
Marked as spam
Posted by (Questions: 3, Answers: 4)
Asked on December 6, 2018 10:05 pm
2438 views
0
Private answer

I think the first thing I have to say is that I remember the struggles I had when first learning to write code for trading platforms. Often times the real struggle is a result of not understanding the tools available (and especially those tools that are NOT available) from the programing language.

In your case the tool that is not available in Thinkorswim is access to create and modify drawing tools. A horizontal line hand-drawn on a chart is nothing at all like a plot from a custom study. The plot from a custom study can only have one value per candle on the chart. It is impossible to create a plot statement in a custom study that plots multiple overlapping lines on the chart.

So your brute-force method of repeating blocks of code is the only way to achieve your stated goal.

Again we’ll go back to the difference between a hand-drawn horizontal line and a plot. The hand-drawn line has start and end points. The plot does NOT. Changing the style to HORIZONTAL merely masks this fact. The plot still continues from the first bar on the chart to the last. Period. You may shift (or displace) a plot, a specified number of bars left or right. But you cannot define any sort of “extension”. Any method you apply to shift the plot left or right will impact every single bar on the chart.

About the only solution I can provide from your request is to set when a plot is displayed based on whether the daily bar was up or down.

def plotOne = close(period = AggregationPeriod.DAY)[1] > open(period = AggregationPeriod.DAY)[1];
plot linehigh1 = if plotOne then high(period = “day” )[1] else Double.NaN;

In order to expand this so as to include a user input to select up or down bars:

input direction = {default Up, Down};
def plotOne;
if (direction == direction.Up) {
plotOne = close(period = AggregationPeriod.DAY)[1] > open(period = AggregationPeriod.DAY)[1];
} else {
plotOne = close(period = AggregationPeriod.DAY)[1] < open(period = AggregationPeriod.DAY)[1];
}
plot linehigh1 = if plotOne then high(period = “day” )[1] else Double.NaN;

Hope that helps clear things up a bit.

Marked as spam
Posted by (Questions: 37, Answers: 4079)
Answered on December 7, 2018 7:48 am
0
Thanks a lot Pete for your quick response. I incorporated your code suggestion and it works correctly if I choose to have only one day. However I tried to expand it to second day and I get inconsistent results. I am unable to attach screen shot in the comment section, but I will paste my modified code below. ################# input direction = {default Up, Down}; def plotOne; if (direction == direction.Up) { plotOne = close(period = AggregationPeriod.DAY)[1] > open(period = AggregationPeriod.DAY)[1]; } else { plotOne = close(period = AggregationPeriod.DAY)[1] open(period = AggregationPeriod.DAY)[2]; } else { plotTwo = close(period = AggregationPeriod.DAY)[2] < open(period = AggregationPeriod.DAY)[2]; } plot linehigh2 = if plotOne then high(period = “day” )[2] else Double.NaN; linehigh2.SetPaintingStrategy(PaintingStrategy.HORIZONTAL); linehigh2.SetDefaultColor(Color.VIOLET); ################## I notice that if the previous bar is up, current bar is up and next bar is also up, then I get the second day plot correct. If there is a down bar in between, it doesn't print it for the second day. Also I see that sometimes it does it on down bar as well. I used EURUSD daily chart to test this out. I request you to please help. I wanted to bring your attention to another interesting thought for plotting a horizontal line extension based on number of days value in the settings. Is it possible to achieve this by using the functions such as BarNumber() and IsNaN or !IsNaN. Please let me know what you think. Thanks once again for your help!
( at December 7, 2018 10:23 am)
0

Go back and review your code. There are numerous errors. Just plain typos. We really are at our limits here in assisting you in the Q&A forum. Very difficult to pass code back and forth in comments. Sorry but there are limitations to what we can provide for free.

As to the extension of your lines. Stop trying to figure it out. Trust me when I say if there was a way I would have already figured it out. Been doing this 10 years. Not trying to say I know it all. I learn new things everyday and that’s what keeps me engaged in this stuff. Just saying what you are trying to do with these line extensions is impossible in this platform. Not difficult, not challenging… impossible.

( at December 7, 2018 11:19 am)
0

Hello Pete,

I get your point. I trust you. For me, you are the authority! There is no point in wasting the time in searching for an ‘impossible’ answer! I have found my bug and fixed it. I am very happy with what I am seeing on my chart! A BIG THANK YOU. You are truely an amazing person, very kind hearted! Thank you!

( at December 7, 2018 2:50 pm)