| ♥ 0 |
Hi Pete, Thanks for all your help with educational videos. I was trying to create a scan based on below and having no luck. If you can please help me with this scan TimeFrame = Based on first 30 Min of Trading Day 8.30 to 9.00 Retracement near 0.05% of 1.272 Thanks for your help.
Marked as spam
|
|
Private answer
Before getting into the details it is absolutely crucial you understand that scans on Thinkorswim are based on Eastern Timezone. The times you have given are not the first 30 minutes of the trading day. Not for the Eastern Timezone. So I will treat this as if you did not know this, and I will base everything here on the Eastern Timezone. Which means we have a start time of 9:30 am and an end time of 10:00 am. The easiest way to write this is to make sure the study filter is set to 30 min time frame and to exclude extended trading hours. Doing so, means the first bar of each new day becomes our high and low for the fibonacci levels. Here is the code based on the details I provided above. The time frame of the Study Filter must be set to 30 min. Unless you want the fibonacci level to be computed from the first hourly bar, in which case you would change the Study Filter time frame to Hour. (or some other time frame that you determine). The point is, this code computes the 127.2% fib level from the first intraday bar of a new trading session.
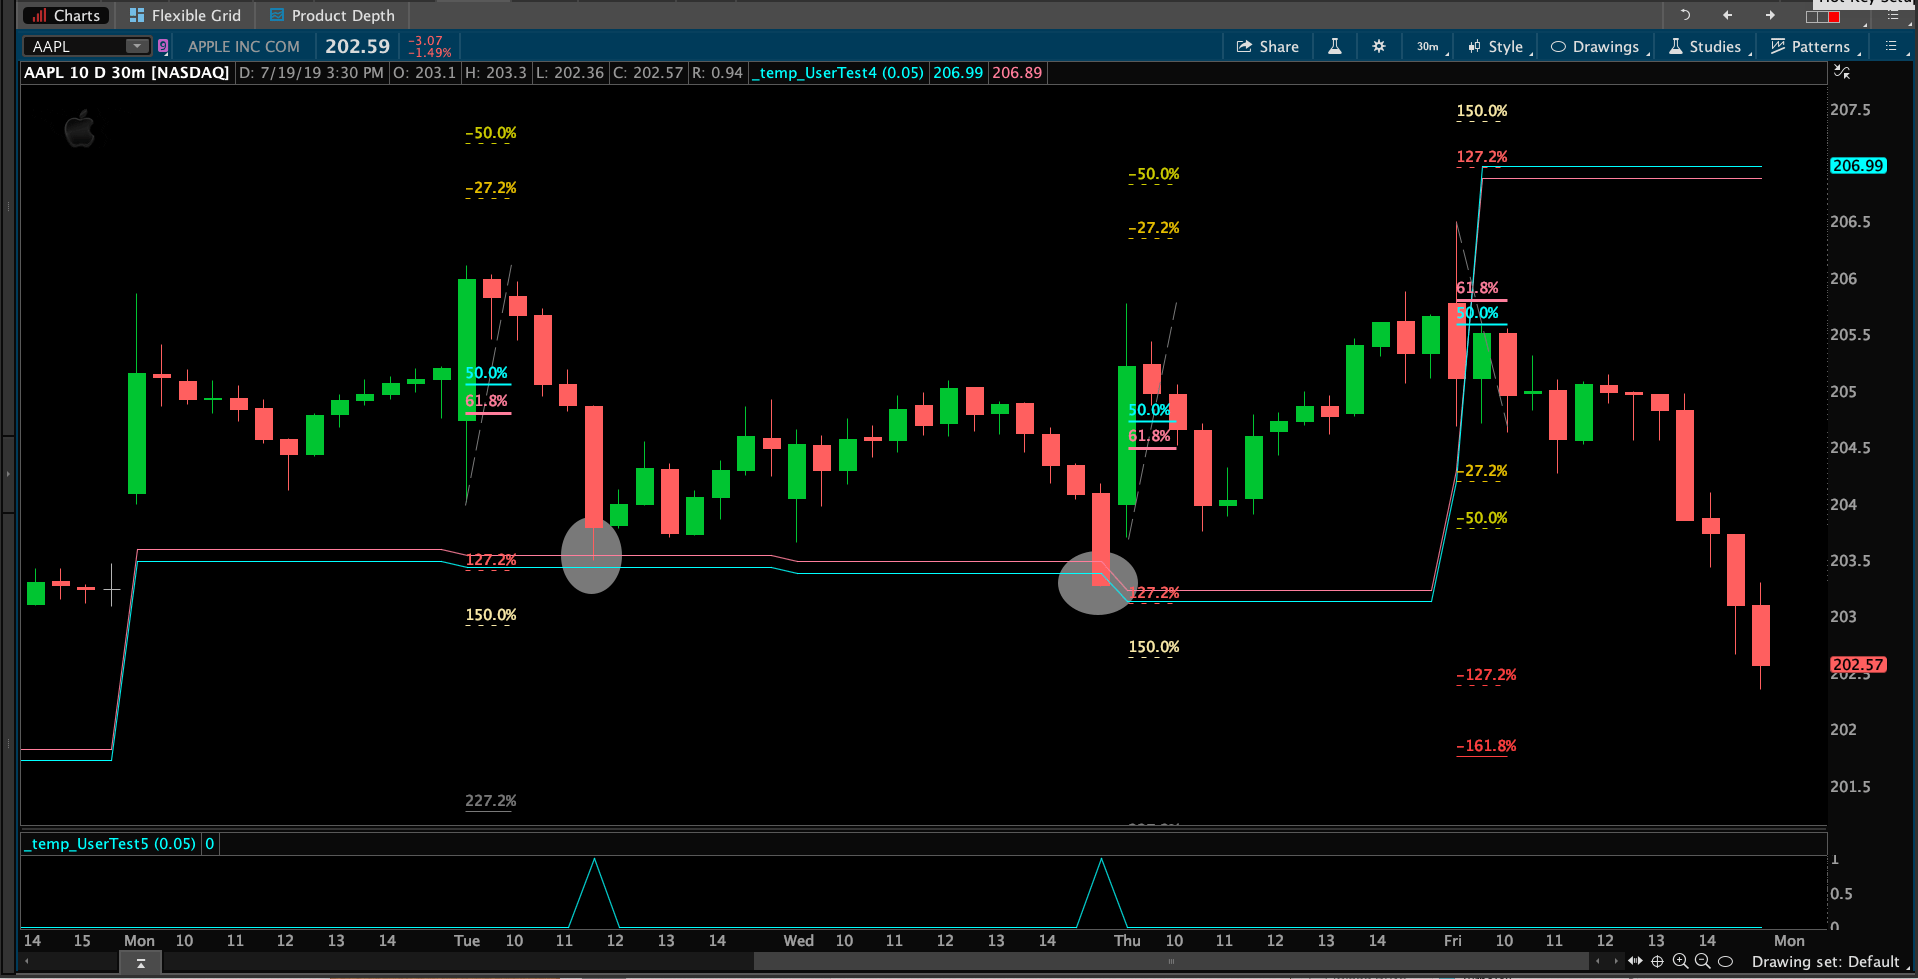
The screenshot below shows the result of the scan on a chart. The two spikes on the lower subgraph shows the points at which the scan results would be true for this stock. The fibonacci drawings were added to demonstrate my code automatically adjusts based on the direction of the opening bar. The red line just before the 127.2% level is the 0.05% threshold. Attachments:
Marked as spam
Answered on July 20, 2019 11:08 am
|