In response to question from Yvens Junior Ulysse
can this be made into a scanner? been trying and couldnt get it to work
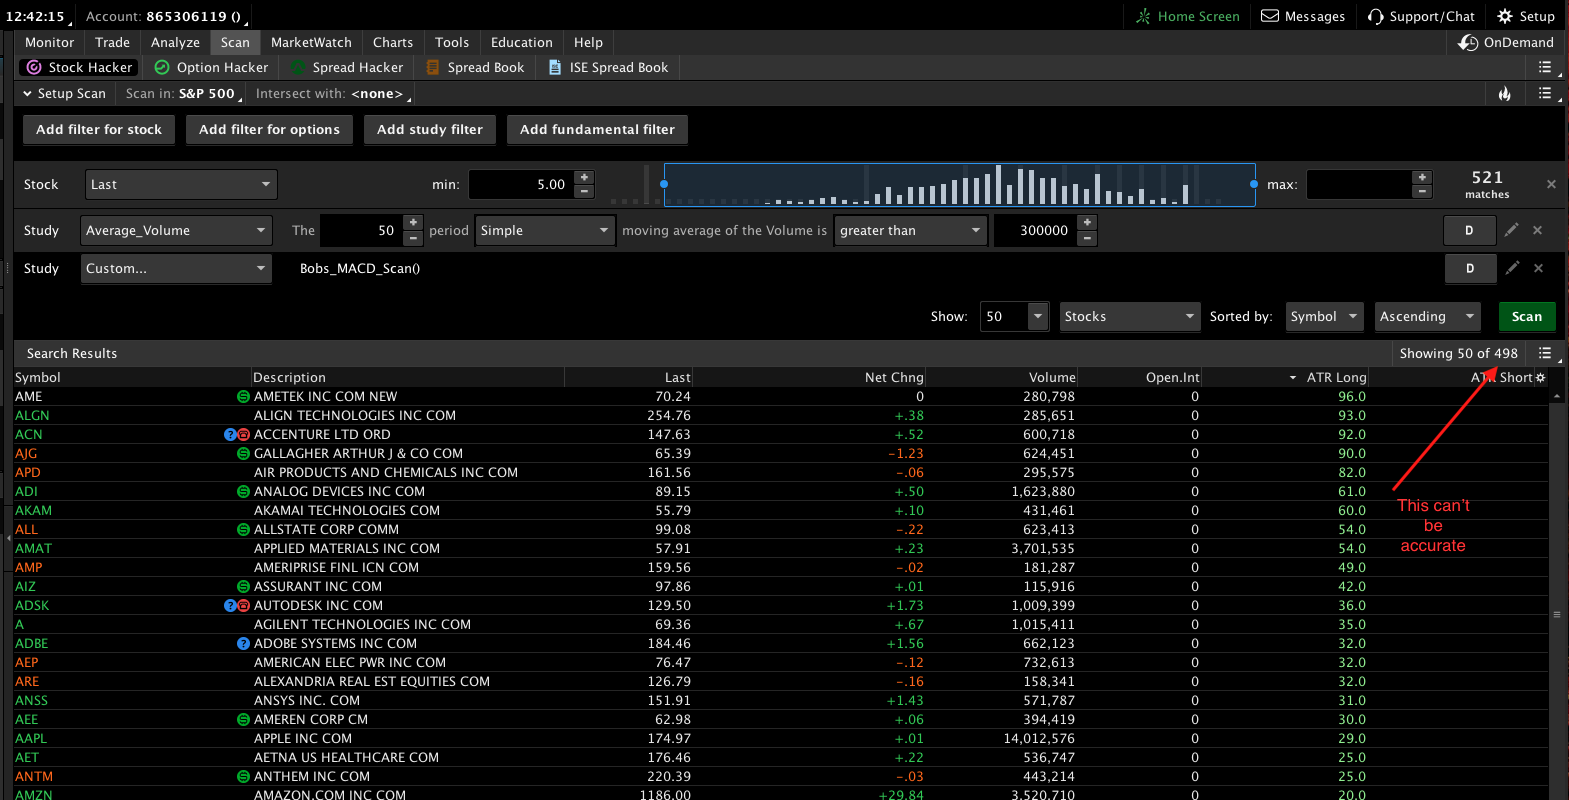
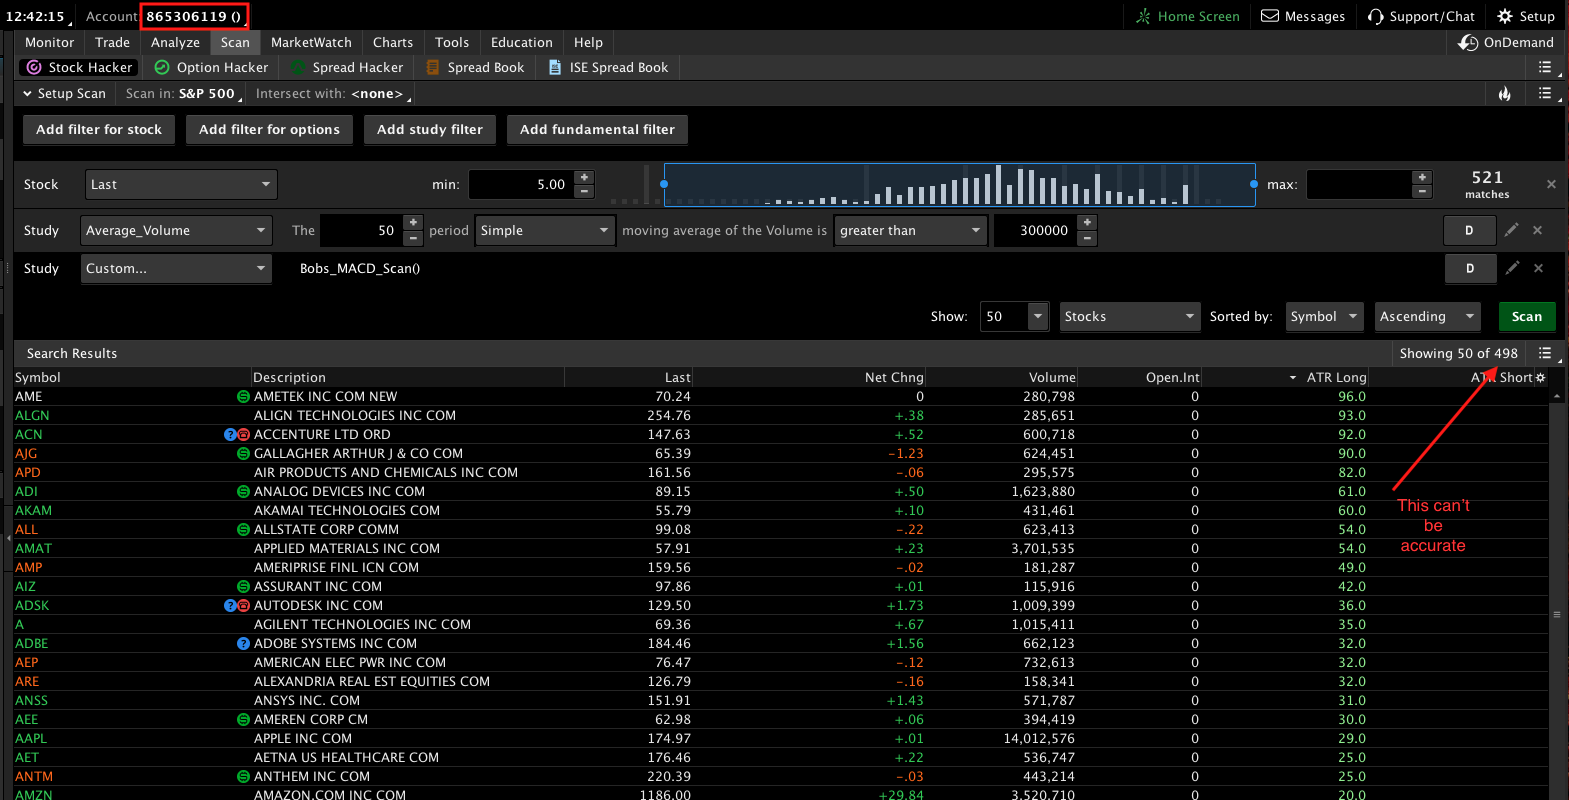
Yes, and instead of just giving you the code I will try to explain the process so you can apply this method to other studies.
You see in the code there are 6 statements that begin with the word “plot”. A scan will only permit a single “plot” statement. Start at the top of the code, and change the first four “plot” to “def”. So we convert the first four to “def” because we still need those values. Once you do this, you will notice several statements immediately below these that turn red. Those are style statements for the plots. We changed them from “plot” to “def” so they will not accept style statements. We simply delete those lines. All the way from Value.SetDefaultColor(GetColor(1)); down to ZeroLine.SetDefaultColor(GetColor(0));
Next, we need to get rid of the two plot statements at the bottom. Likewise, each of these are followed by style statements. Once you delete the last two plot statements those style statements will turn red and need to be deleted.
So having followed these steps the last two lines of code should be:
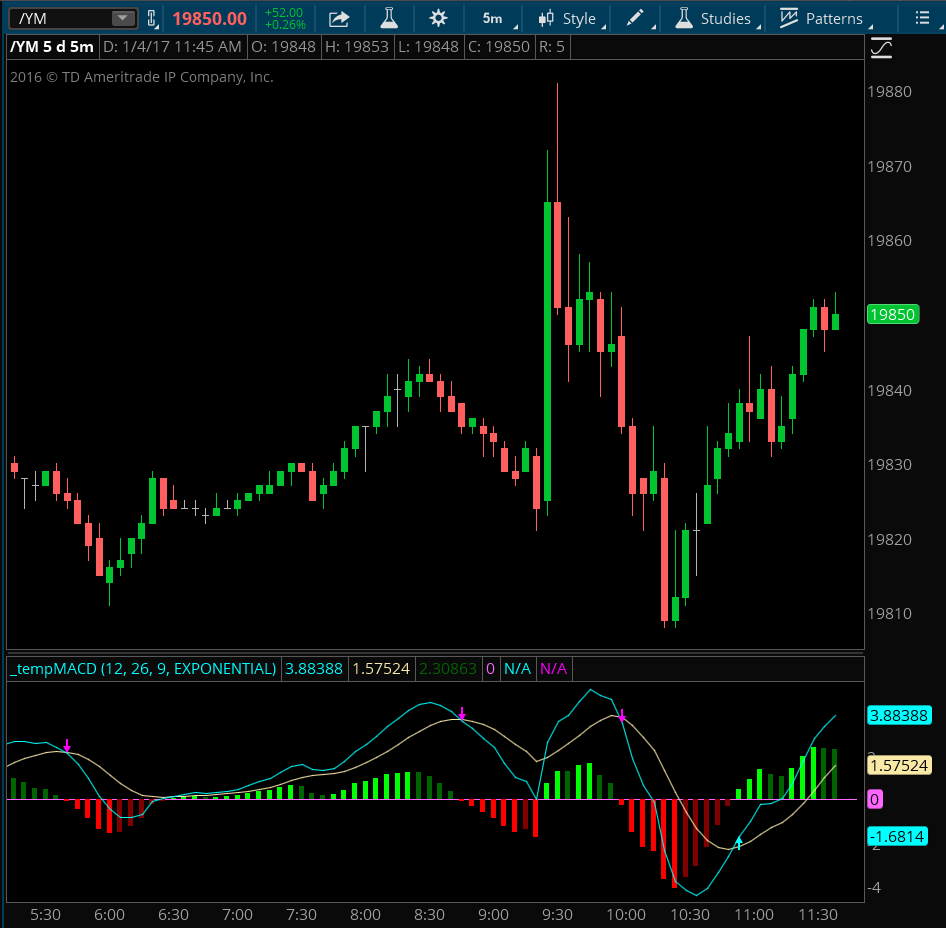
def ValueCrossBelowZeroline = Value[1] < Avg[1] and Value[1] < 0 and Value > Avg;

def ValueCrossAboveZeroline = Value[1] > Avg[1] and Value[1] > 0 and Value < Avg;
These are the signals we’ll use in the scan.
If you want to scan for both conditions at the same time you will use:
plot scan = ValueCrossBelowZeroline or ValueCrossAboveZeroline;
And if you want to scan for each signal separately you will use one of the following:
plot scan = ValueCrossBelowZeroline;
or
plot scan = ValueCrossAboveZeroline;
Don’t worry if it doesn’t work out the first time. If you don’t get a working scan the first time through, don’t try and patch it together. Just erase all the code and start over from the beginning.
Hope it helps.