Flat base breakout scans


Category:
0
0

Hi Pete,

What is the best way to implement a scan in TOS for a flat base breakout?

can you please give out an example of such scan ?

Thank you


Marked as spam
Posted by (Questions: 13, Answers: 13)
Asked on December 17, 2016 6:54 pm
3658 views
0
Pete, I am trying to do the exact opposite… I want the breakout to be to the short side in the form of a 5-10% gap with a wide range candle. I have flipped the code to the best of my ability. But, do not know how to code it for a gap with a wide range candle.
( at January 24, 2020 5:19 am)
0
Looks like the code you tried to post in the comment was cut-off short. I see this post is quite muddy already with all the back and forth trying to nail down the specifications. So I suggest you post a new question and link to this one in your description of this new request. Be sure to include your code.
( at January 24, 2020 8:09 am)
0
Post as a new question. Not as a solution to this question.
( at January 26, 2020 8:31 am)
0
I don't know how else to say this. When I say "post this as a new question" What I mean is to stop adding comments to this question. Stop adding comments to any part of this exact webpage. Create a new post. Create a new question entirely. And when you do so, be sure to include the URL Address of this question.
( at January 27, 2020 8:12 am)
1
Private answer

I anticipate the solution to this would be extremely complex. First challenge is to define within the code what a flat base looks like. I imagine there is a large degree of variability which needs to be taken into account. Thinkorswim has a relatively new feature that allows user to define custom candlestick patterns. There may be a way to define a flat base using this tool. I haven’t used it yet so I’m just guessing. I think you should provide 2-3 screen shots showing examples of flat bases. Your examples should include the range of variability you are trying to cover.

Marked as spam
Posted by (Questions: 37, Answers: 4086)
Answered on December 17, 2016 7:57 pm
1
Private answer

There are a few gray areas in your specifications.

“…fairly tight price range…”

“…defined trading range…”

“…smal daily trading ranges…”

Perhaps you have more specific definitions for these. Something that is based on an existing study, or at least something that can be expressed mathematically.

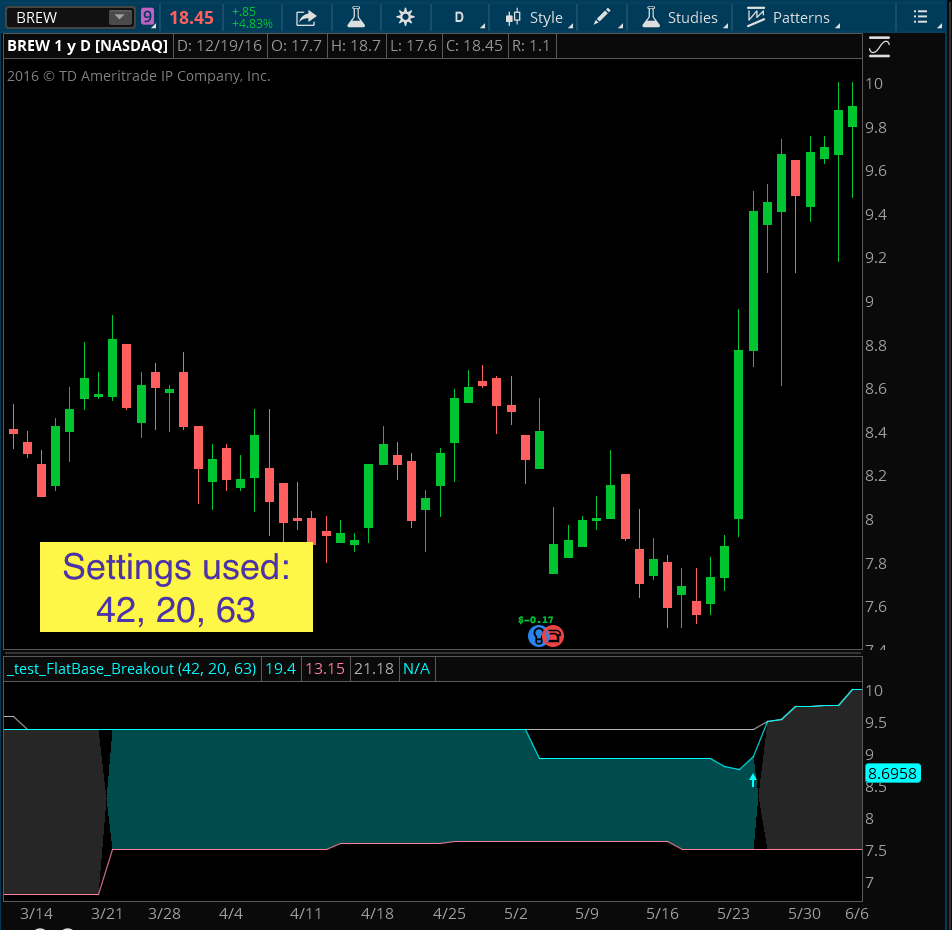
So given the items that are black and white, I drew up the following code to run scans. Attached is a screenshot showing the stock you listed during the reference period. The lower subgraph shows how the code views the price action. The areas shaded in blue are what the code believes to be “defined ranges”. The code I list here is strictly for scans, not intended to plot on a chart. It’s important to note that the first input needs to be a greater value than the last input.

input spanOfBase = 25;
input maxPrctCorrection = 10;
input spanOfBreakoutHigh = 42;
def flatBaseHigh = highest(high[1], spanOfBase);
def flatBaseLow = lowest(low[1], spanOfBase);
def percentMaxCorrection = AbsValue(100 * (flatBaseLow / flatBaseHigh - 1));
def withinPrctCorrectionLimits = percentMaxCorrection <= maxPrctCorrection; def highShade = if withinPrctCorrectionLimits then flatBaseHigh else flatBaseLow; def lowShade = if withinPrctCorrectionLimits then flatBaseLow else flatBaseHigh; def flatBase = highShade > lowShade;
def highestHighForBreakout = highest(high[1], spanOfBreakoutHigh);
def currentBreakoutHigh = high > highestHighForBreakout;
# only one of these can be scanned for at one time. Use "#" comment marks to turn off
# the one you don't need
plot flatBaseFormation = flatBase and currentBreakOutHigh == 0;
#plot breakOutSignal = currentBreakOutHigh and currentBreakOutHigh[1] == 0 and flatBase;

The scan runs in two different modes. One searches for current flat base formations. Use this to study the resulting patterns and decide if further adjustments are needed to the code. The second searches for the actual break out signals.

Attachments:
Marked as spam
Posted by (Questions: 37, Answers: 4086)
Answered on December 19, 2016 12:09 pm
0
How do you adjust it for 4 weeks? Im not getting the input spanOfBreakoutHigh = 42; part
( at June 16, 2020 8:28 pm)
0
Private answer

Good question Pete.

Here is what I am thinking about flat base scans:-


  1. A stock the closing price of which is higher than its highest high over the previous 60 days.
  2. The flat-base pattern shows that a stock is moving within a defined trading range.
  3. The flat-base moves straight sideways in a fairly tight price range for at least five weeks and does not correct more than 10% to 15%,
  4. Flat bases are characterized by small daily trading ranges.


Example

BREW from 3/24/16 to 5/24/2016

Marked as spam
Posted by (Questions: 13, Answers: 13)
Answered on December 17, 2016 10:04 pm