| ♥ 0 |
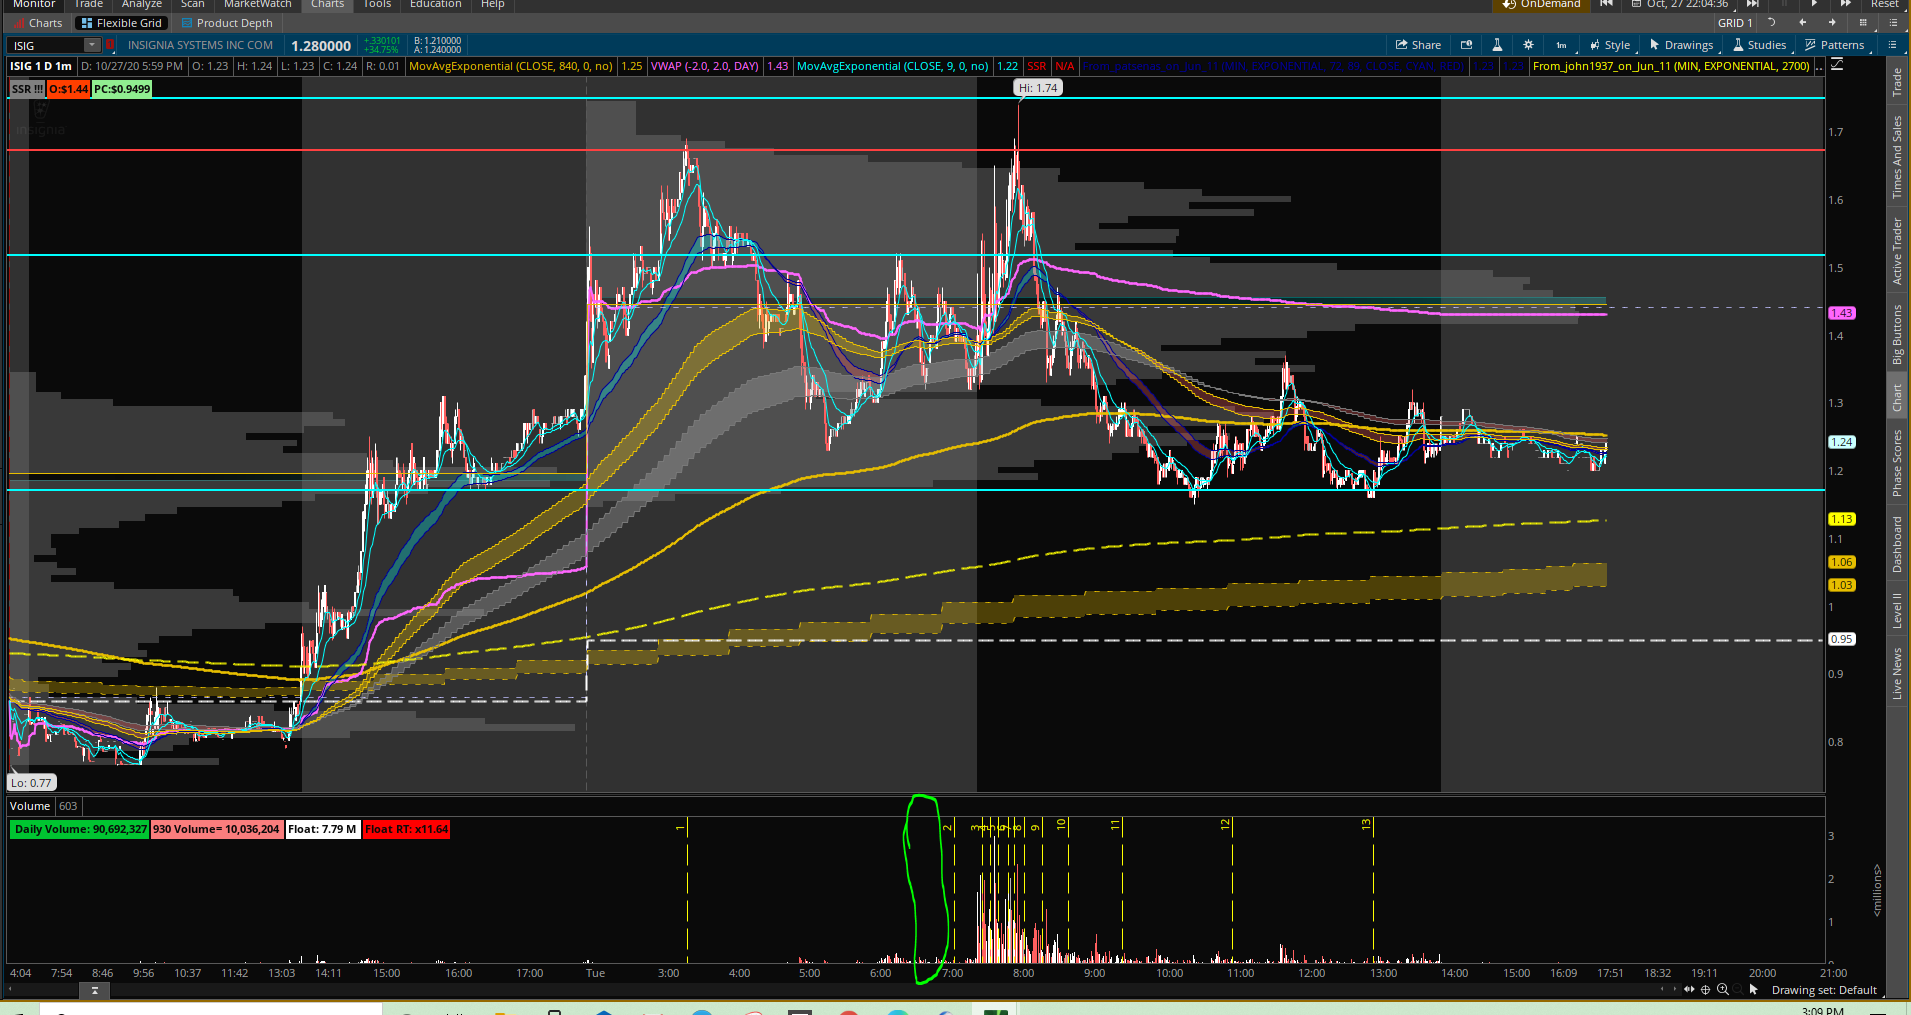
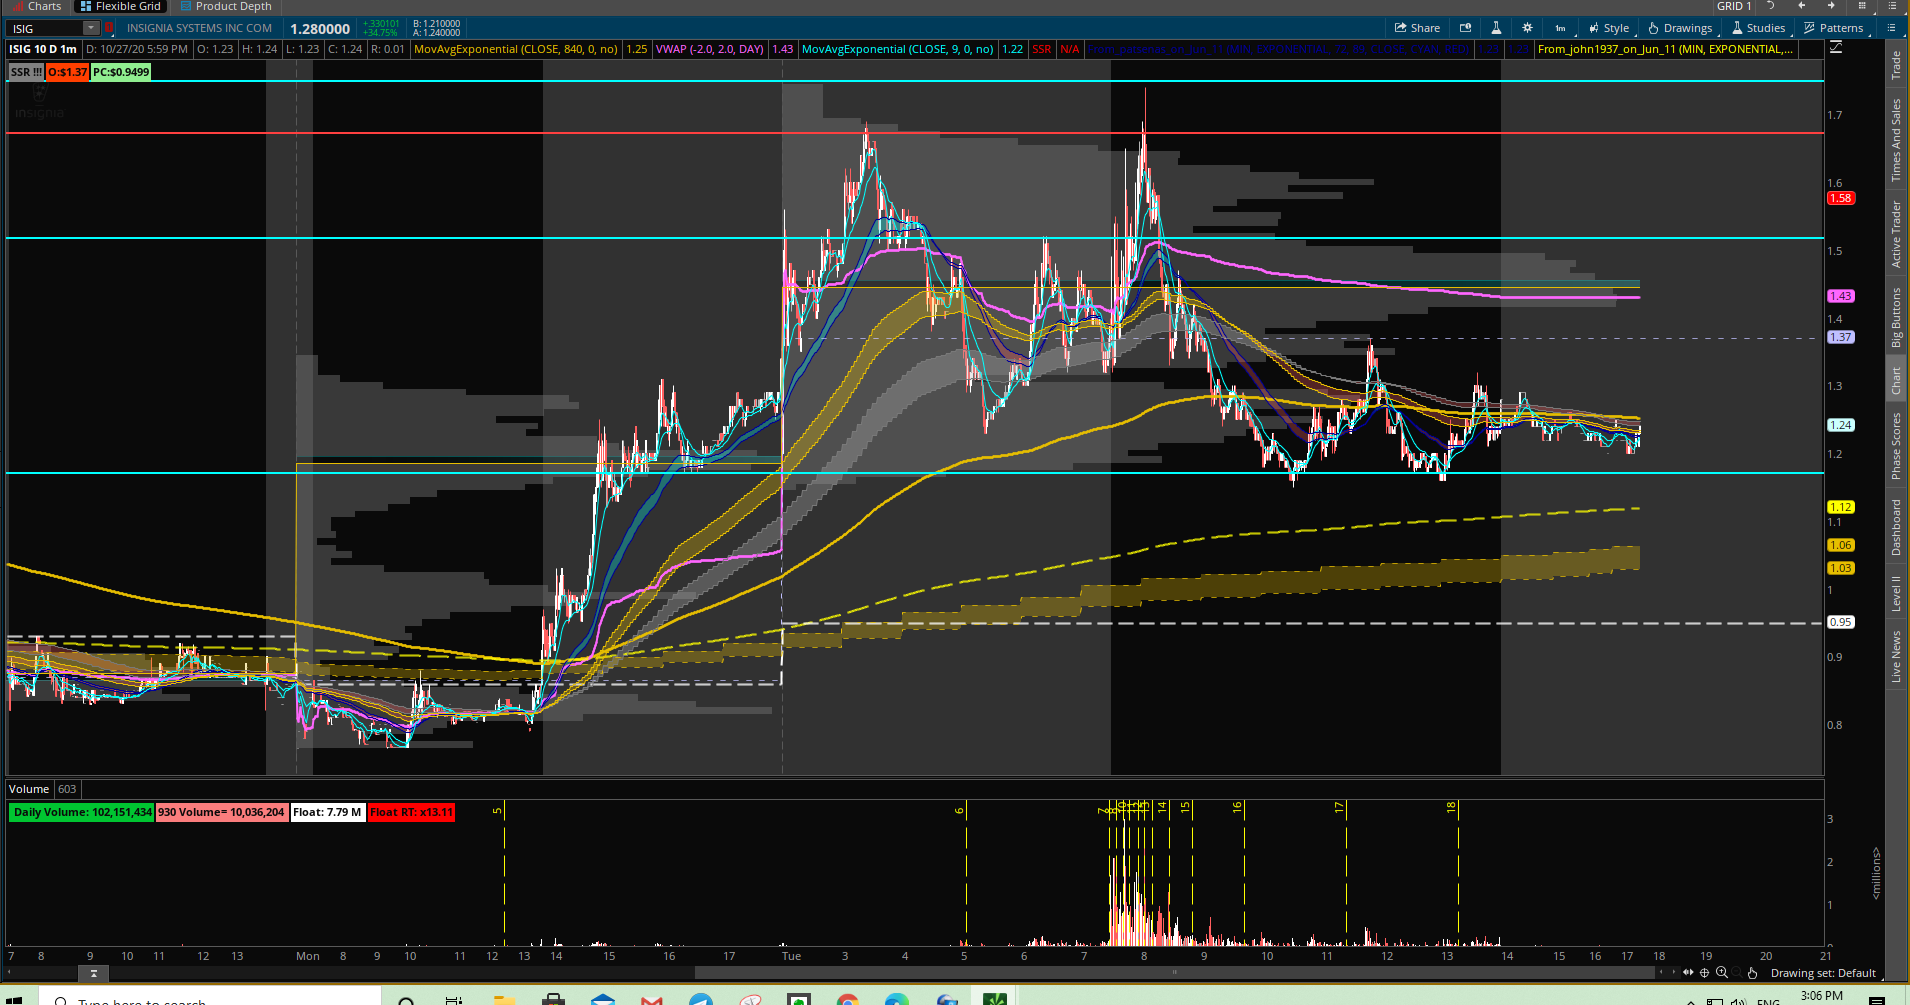
Hi. I found this code to plot float rotation on the volume sub graph and there are some problems I have with it but lack the knowledge to fix it. It would be awesome if you’re able to help. Problem 1: As of now, when on a 1d:1m timeframe the vertical lines being plotted seem to be a little skewed in Premarket as if the volume being used includes data from the previous day after hours session. Its close enough but if it can be fixed that would be preferred. Problem 2: I have to specifically be on a 1day chart for it to work otherwise it will calculate rotation based on the cumulative volume from days prior. SEE IMAGE: 10d1mISIG Solution: I’m looking for it to plot the float rotation lines for the CURRENT day only when premarket opens regardless of timeframe and period. In the image 1d1mISIG, You can see where the float rotation should have occurred in premarket vs where the study said. In the other image you can see that its already on rotation 6 in premarket.
Attachments:
Marked as spam
Asked on November 2, 2020 3:33 pm
310 views
|