We can do this very simply through the use of the condition wizard. If you are not familiar with it, there are tons of examples on this forum. Just search the term “condition wizard”.
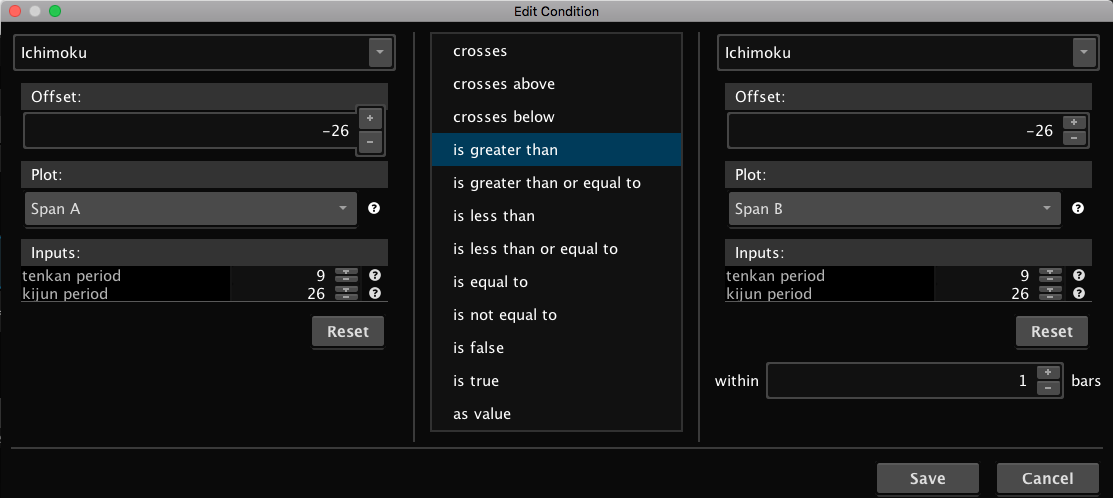
From the condition wizard we build a condition that references the “Span A” plot from the Ichimoku on the left side, set the center section to “is greater than”, and set the right side to reference the “Span B” plot from the Ichimoku. Last step is to set the Offset to -26.
Why set the offset to -26? Because the default setting of the Ichimoku causes the cloud plots to be shifted 26 bars into the future. In order to read bars in the future of the chart we need to apply a minus sign to the value. If you change the value of the Kijun Period input you will need to adjust -26 to match.
So this creates the scan for the bullish condition of the Ichimoku cloud, 26 bars to the right of the last candle on the chart. You can probably work out the bearish side on your own. Screenshot shows how the condition is constructed.
Update 10/31/18
The author of this post has requested a modification to the specification. This modification would ensure the Ichimoku cloud remained bullish for the entire span which extends into the empty right hand side of the chart.
This requires a code based solution. Can't do this through Condition Wizard. So I took the basic elements from the code provided by Thinkorswim in their Ichimoku study added a few things. The first thing I did was to remove the shift that is applied to the cloud. So in this code the cloud is actually in line with current price bars and not shifted 26 bars into the future. Then I added a couple statements to test the status of the cloud for the previous 26 bars.
Here is the code.
input tenkan_period = 9;

input kijun_period = 26;

def Tenkan = (Highest(high, tenkan_period) + Lowest(low, tenkan_period)) / 2;

def Kijun = (Highest(high, kijun_period) + Lowest(low, kijun_period)) / 2;

def spanA = (Tenkan + Kijun) / 2;

def spanB = (Highest(high, 2 * kijun_period) + Lowest(low, 2 * kijun_period)) / 2;

def bullishCloud = spanA > spanB;

def solidBullish = Lowest(bullishCloud, kijun_period) > 0;

plot scan = solidBullish;
I have updated my answer to include a solution for this additional specification.
This works great. You are awesome. I appreciate your forum and all you have done here. Thanks!
Hi Pete,
After some further scans this is not producing reliable results. Many like AEE, AES and AON (see here: https://www.evernote.com/shard/s39/sh/b3e5b090-6800-4660-bdea-1c04ce67a093/01f3318c2b6d29e1d6f079c24aa58d21) are still being returned based on the defined code. Any ideas?
Thanks
Justin
You need to double check your scan settings. You may not have the chart and the scan set to the same time frame. I just ran a scan and ran through the first 30 results and found zero false signals.
You are right. I didn’t have my scan and chart time frames aligned. Thank you!