MACD Histogram Reversal


Category:
0
0

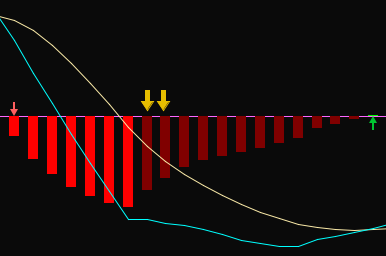
Hey man, I appreciate you taking the time to help others with their platform setups it sure has helped me a lot while lurking on here. I even developed a list of things I wanted to figure out for weeks but I don’t want to bombard you with requests so I’ll just post the one that has me going crazy the most haha. So my question is, can you please develop a scan script where I’m able to see the MACD histogram turn from a bright red bar to a dark red bar (negative but going up) at least 1-2 times on the daily chart? This will help many of us know when a stock is almost ready to make a reversal.

(I’ve indicated what I meant in yellow arrows on the screenshot I’ve attached)

Thanks

Attachments:
Marked as spam
Posted by (Questions: 12, Answers: 20)
Asked on October 27, 2018 2:22 pm
501 views
0
How can i adjust if i want to scan for stocks with atleast 4 dark red bars. I think this will tell me its getting closer to the zero line
( at October 7, 2019 5:03 pm)
0
This requires a brute force method. I don't see an elegant solution to this. plot scan = Diff < 0 and Diff > Diff[1] and Diff[1] > Diff[2] and Diff[2] > Diff[3] and Diff[3] > Diff[4];
( at October 7, 2019 5:33 pm)
0
Private answer

I updated the title of your question from “slow down” to “reversal”. Seems to me from your screenshot that is more in line with your request.

You will find the code I provided for our MTF MACD scan will do exactly this. Follow the steps in this article but only apply it to a signal time frame. Code is included: https://www.hahn-tech.com/thinkorswim-mtf-macd-scan/


Update: 10/29/18
After receiving additional details I have the following code to offer.

input fastLength = 12;
input slowLength = 26;
input MACDLength = 9;
input averageType = AverageType.EXPONENTIAL;
def Diff = MACD(fastLength, slowLength, MACDLength, averageType).Diff;
plot scan = Diff > Diff[1] and Diff < 0;

Marked as spam
Posted by (Questions: 37, Answers: 4084)
Answered on October 27, 2018 4:49 pm
0
Thanks for the response Pete. Just a little issue, the script is giving me inconsistent results. I’m not sure if I did it wrong but this is what I entered into the thinkscript: input fastLength = 12; input slowLength = 26; input MACDLength = 9; input averageType = AverageType.EXPONENTIAL; def Diff = MACD(fastLength, slowLength, MACDLength, averageType).Diff; plot scan = Diff[1] >= Diff[2]; The result I was expecting was stocks to be filtered to only show me negative momentum to be increasing from bright red, to dark red, to dark red again. But I would click ”scan” it would show me 34 stocks (with the other standard filters I put in such as price, shares, etc) but out of those 34 stocks 9 of them did not meet the MACD criteria at all.
( at October 28, 2018 10:09 am)
0

Your screenshot show two dark red histogram bars. MACD below zero and just beginning to move back to zero line. The code from that article looks for MACD histogram higher than previous value. Which would include begin above the zero line. So what you want to to capture the reversal, or pivot of the histogram.

Change this line of code:
plot scan = Diff[1] >= Diff[2];

To this:
plot scan = Diff > Diff[1] and Diff[1] < Diff[2];

( at October 28, 2018 12:52 pm)
0
Perfect! I see that changing it to that line of code allows me to search for stocks with 1 dark red bar. The only issue now is that it filters out stocks like BLIN that have 4 consecutive dark bars or MBRX which have 6 consecutive dark bars.
( at October 28, 2018 2:03 pm)
0

When you posted this question you really should have explained your full specification from the start. I understand many find it challenging to express their complete specification the first time. So I get it. I deal with this all the time so don’t think I’m picking on you or complaining in any way.

Go back and read your original question. You only asked for 1 or 2 dark red bars. But here you have clarified that to be as many as 6. So exactly how many is it? And what else is missing from your description?

What I suggest is that you take some time to research the exact pattern you are looking for and post this again to include every last detail you think of. You really do need to think and speak like a computer in order to break down your patterns and express them as a set of hard and fast rules. Pure logic.

( at October 28, 2018 3:26 pm)
0

I did. It’s on my original post “at least 1-2 times on the daily chart”. Thanks bud.

( at October 28, 2018 3:29 pm)
0

So back to 1-2 consecutive bars. You don’t need to have BLIN or MBRX, at 4 and 6 consecutive bars?

( at October 28, 2018 5:28 pm)
0

It doesn’t specifically need to be 4-6 bars it can be 3000 dark bars, the max number doesn’t matter. I just want it to capture MACD’s bar curl early without filtering out stocks that have a bunch of dark bars already. The only ones that need to be filtered out are stocks that have had bright red bars in the last two trading sessions.

So it should be able to pick up stocks like APHB (it has 8 dark bars) remember.. the max amount of dark bars don’t matter.

It should also pick up WHLR (it has 2 dark bars) being that it has at least 2 dark bars.

( at October 28, 2018 6:19 pm)
0

I have updated my answer to provide updated code. This is the simplest way to capture all stocks with dark red bars on the MACD histogram without limiting the number of consecutive dark red bars. But there will still be patterns you don’t want.

( at October 29, 2018 9:20 am)