FullD Color change Signal


Category:
0
0

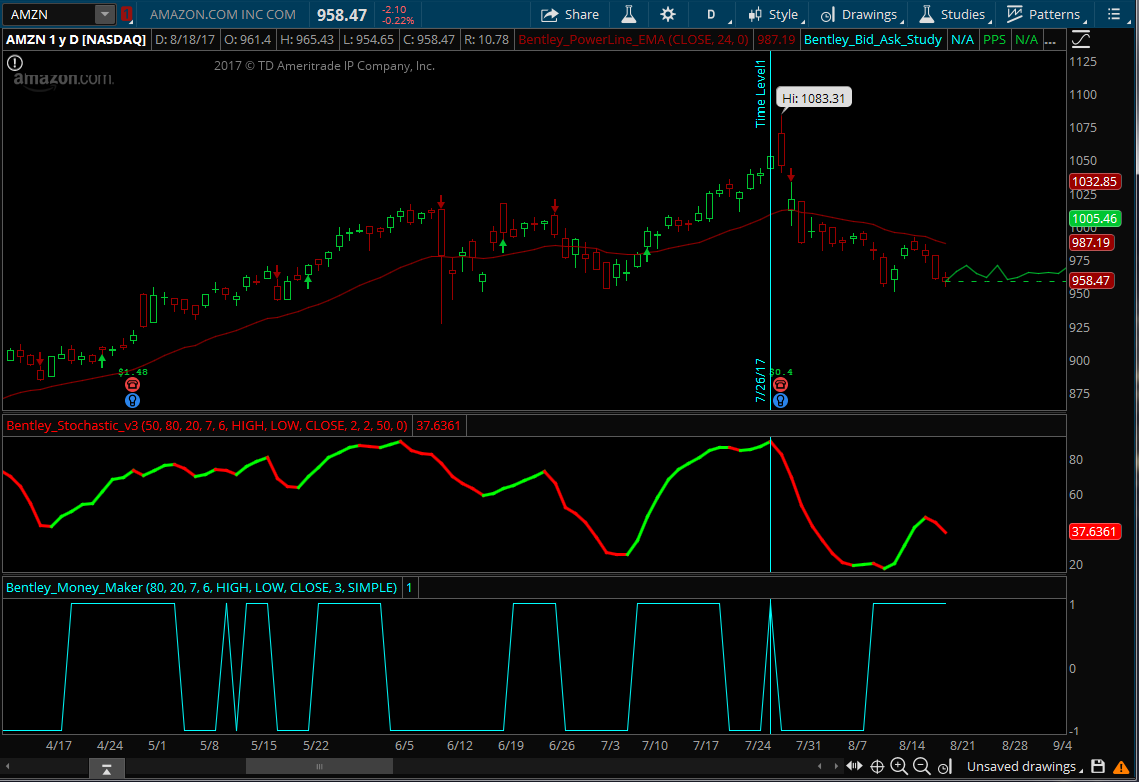
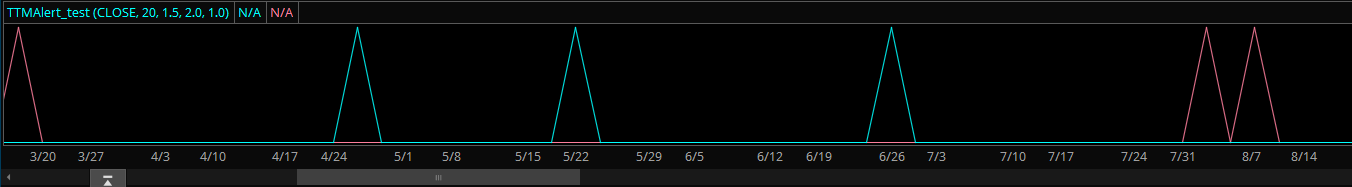
Hello all,

I’m having trouble modifying a StochastichFull indicator that was customize for the FullD to change color when certain conditions are met. I tried to modify the code to add an alert and to use it with a scan, when the colors change from red to green. Please see my code changes  below along with original color plot of the FullD.

My Changes

declare lower;

input over_bought = 80;
input over_sold = 20;
input KPeriod = 7;
input DPeriod = 6;
input priceH = high;
input priceL = low;
input priceC = close;
input slowing_period = 3;
input averageType = AverageType.SIMPLE;

def lowest_k = Lowest(priceL, KPeriod);
def c1 = priceC – lowest_k;
def c2 = Highest(priceH, KPeriod) – lowest_k;
def FastK = if c2 != 0 then c1 / c2 * 100 else 0;

def FullK = MovingAverage(averageType, FastK, slowing_period);
def FullD = MovingAverage(averageType, FullK, DPeriod);

plot Data = (if FullD > FullD[1] then 1 else (if FullD == FullD[1] then 1 else -1));


Original Color changes plot statement

FullD.AssignValueColor(if FullD > FullD[1] then Color.green else (if FullD == FullD[1] then Color.green else Color.red));


Attachments:
Marked as spam
Posted by (Questions: 1, Answers: 8)
Asked on August 19, 2017 9:29 am
166 views
0

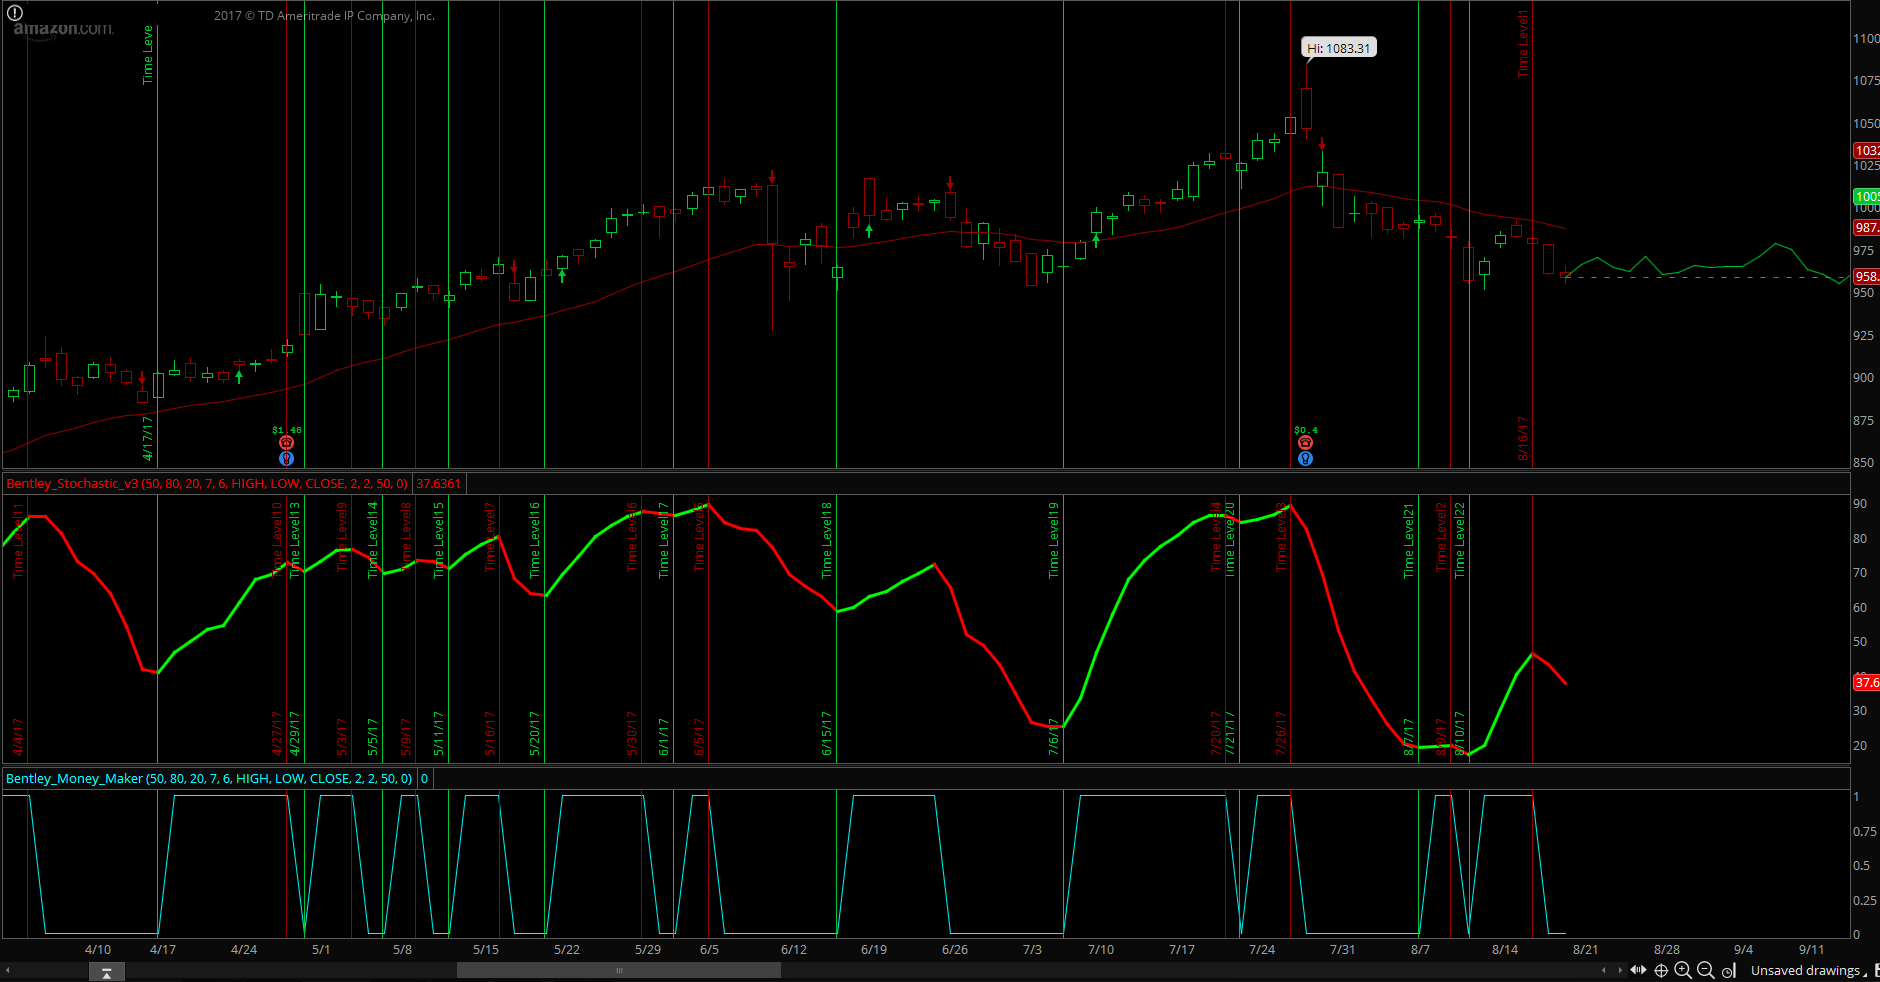
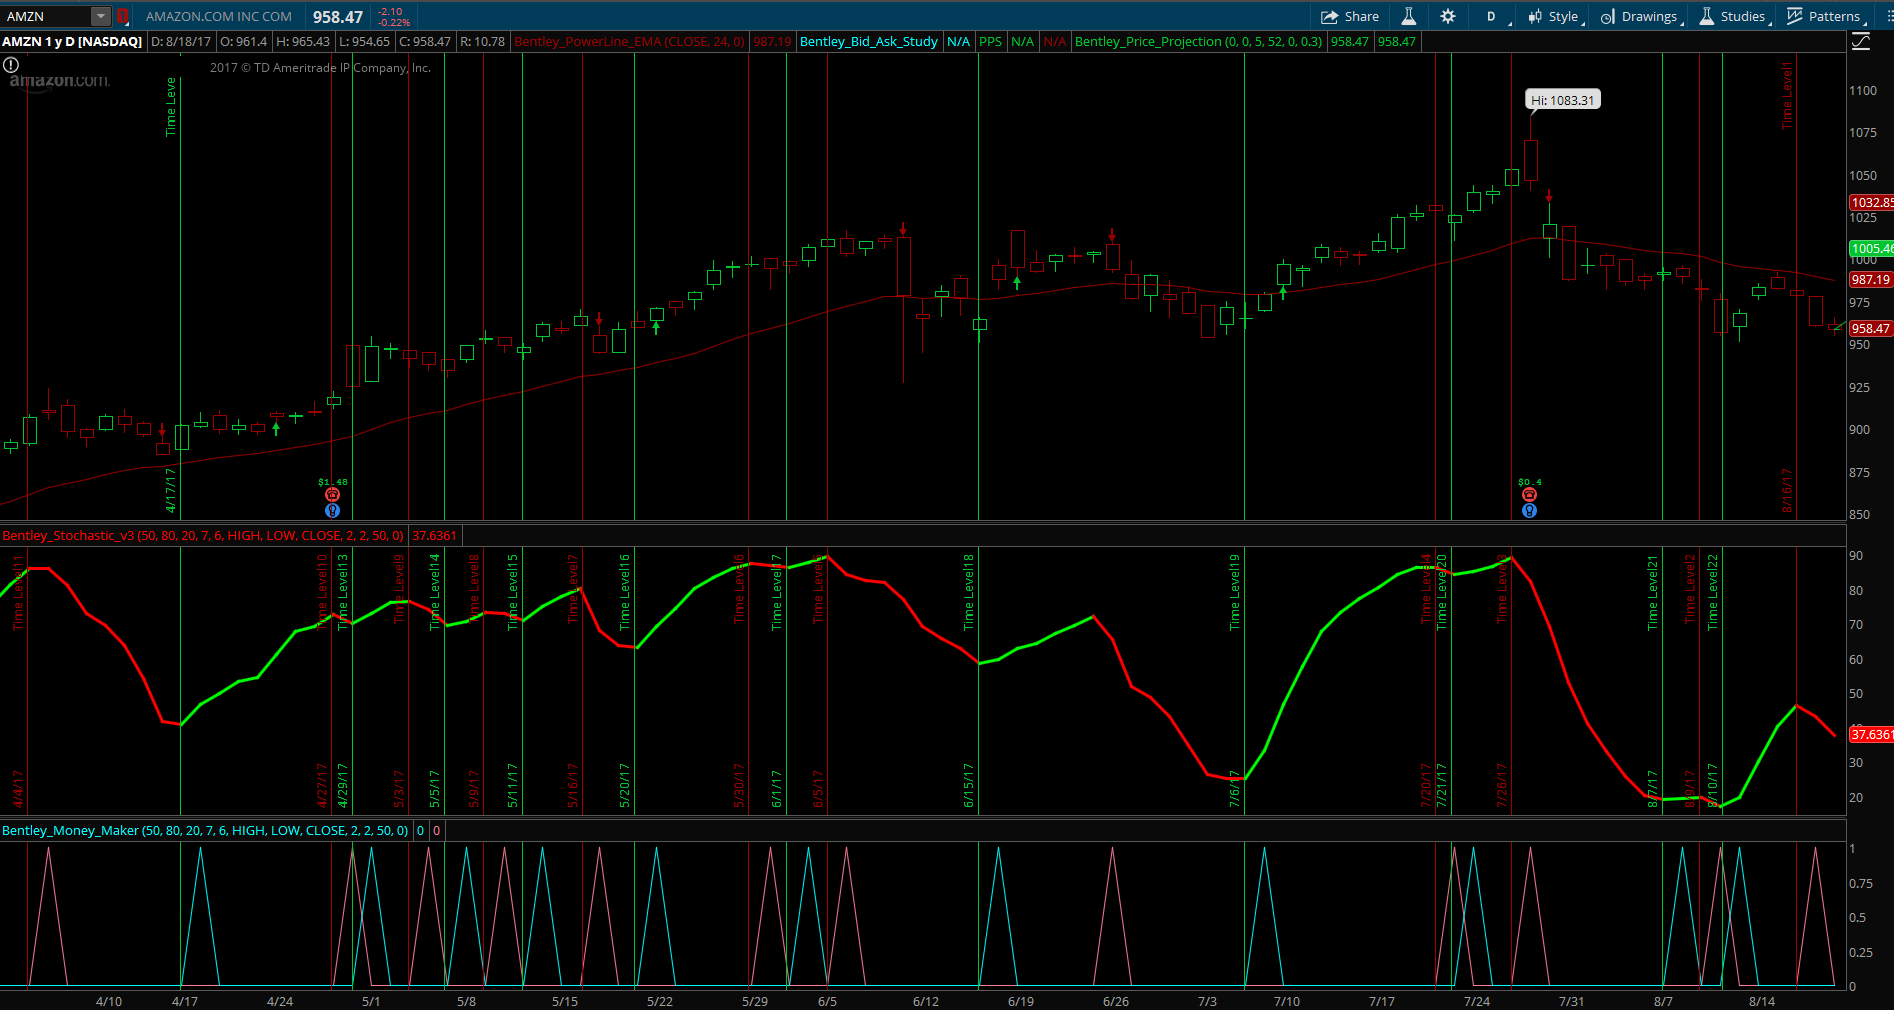
Well the logic in the plot Data statement appears to be an exact match. So what is your concern? Are you wondering why the signals do not match the color changes? Check your settings. The two studies in your screenshot are not using exactly the same settings. Try that and get back to us if this doesn’t clear things up.

( at August 19, 2017 10:57 am)
0
Private answer

FULL Original code, I was just looking to capture the FullD color changes in the alert.

# Bentley_Stochastic_v2

declare lower;
input MidLine = 50;
input over_bought = 80;
input over_sold = 20;
input KPeriod = 3;
input DPeriod = 3;
input priceH = high;
input priceL = low;
input priceC = close;
input slowing_period = 2;
input smoothingType = 1;

input length = 50;
input displace = 0;
def Trnd = Average(close[-displace], length);

def c1 = priceC – Lowest(priceL, KPeriod);
def c2 = Highest(priceH, KPeriod) – Lowest(priceL, KPeriod);
def FastK = c1 / c2 * 100;

plot FullK;
plot FullD;

if smoothingType == 1
then {
FullK = Average(FastK, slowing_period);
FullD = Average(FullK, DPeriod);
} else {
FullK = ExpAverage(FastK, slowing_period);
FullD = ExpAverage(FullK, DPeriod);
}
plot OverBought = over_bought;
plot OverSold = over_sold;
plot Mdln50 = 50;

FullD.AssignValueColor(if FullD > FullD[1] then Color.green else (if FullD == FullD[1] then Color.green else Color.red));
FullD.SetLineWeight(1);

FullK.AssignValueColor(if FullK > FullK[1] then color.green else color.red);
FullK.SetLineWeight(3);

MdLn50.SetDefaultColor(GetColor(0));
OverBought.SetDefaultColor(GetColor(1));
OverSold.SetDefaultColor(GetColor(1));
;

Marked as spam
Posted by (Questions: 1, Answers: 8)
Answered on August 19, 2017 10:03 am
0
Private answer

Yes, my concern is that I dont get the clean spike signals like I see you achieve with other indicator like the MACD/RSI or a TTM Squeeze color change I saw on here on your site. I get these flat top lines, makes sense? My settings for the FullK and FullD are 7 and 6 for both my signal indicator and actual indicator. Both have 80/20 os/ob levels, and the actual indicator uses a 50 midline.

Marked as spam
Posted by (Questions: 1, Answers: 8)
Answered on August 19, 2017 11:41 am
0

The slowing period on the upper study is set to 2 while the slowing period on the lower study is set to 3. This is what I meant when I said they are not exactly the same settings.

( at August 19, 2017 12:12 pm)
0
Private answer

I would like to have these clear signals, that way I can set it has an alert or scan.

Attachments:
Marked as spam
Posted by (Questions: 1, Answers: 8)
Answered on August 19, 2017 11:44 am
0
Private answer

Ok with the clarifications I have a solution. You would like the study to spike only when the color changes. Well the color changes only with the direction of the FullD changes direction. So that’s all we need to write:

def risingFullD = FullD > FullD[1];
def fallingFullD = FullD < FullD[1];
plot changeToUp = risingFullD and fallingFullD[1];
plot changeToDown = fallingFullD and risingFullD[1];

We have numerous examples of this sort of solution throughout the Q&A forum and video tutorials. After performing a thorough search and examining all the examples you should have a very clear idea on how to do these for any indicator.

Marked as spam
Posted by (Questions: 37, Answers: 4079)
Answered on August 19, 2017 12:23 pm
0
Private answer

I marked some price lines and see that there is some alignment, but not in the form of spikes. I would like the green lines and red lines positions to show that spike, so I can trigger an alert or scan on these triggers, if I could trigger green separate from red, that will be ideal to manage in two separate watchlist

Marked as spam
Posted by (Questions: 1, Answers: 8)
Answered on August 19, 2017 12:26 pm
0
Private answer

I marked some price lines and see that there is some alignment, but not in the form of spikes. I would like the green lines and red lines positions to show that spike, so I can trigger an alert or scan on these triggers, if I could trigger green separate from red, that will be ideal to manage in two separate watchlist

Attachments:
Marked as spam
Posted by (Questions: 1, Answers: 8)
Answered on August 19, 2017 12:26 pm
0
Private answer

Sorry, did not see your response. I saw some examples but could not figure out how to apply it to my specific conditions. Thanks for your reply, let me check your response in the code.

Marked as spam
Posted by (Questions: 1, Answers: 8)
Answered on August 19, 2017 12:28 pm
0
Private answer

I appreciate your help… this is the code with your recommendations, also validated that the top referenced indicator has the same settings including the slow period. The signals dont line up?? I dont know what I’m doing wrong.

declare lower;
input MidLine = 50;
input over_bought = 80;
input over_sold = 20;
input KPeriod = 7;
input DPeriod = 6;
input priceH = high;
input priceL = low;
input priceC = close;
input slowing_period = 2;
input smoothingType = 2;

input length = 50;
input displace = 0;
def Trnd = Average(close[-displace], length);

def c1 = priceC – Lowest(priceL, KPeriod);
def c2 = Highest(priceH, KPeriod) – Lowest(priceL, KPeriod);
def FastK = c1 / c2 * 100;

def FullK;
def FullD;

if smoothingType == 1
then {
FullK = Average(FastK, slowing_period);
FullD = Average(FullK, DPeriod);
} else {
FullK = ExpAverage(FastK, slowing_period);
FullD = ExpAverage(FullK, DPeriod);
}
def OverBought = over_bought;
def OverSold = over_sold;
def Mdln50 = 50;

#FullD.AssignValueColor(if FullD > FullD[1] then Color.green else (if FullD == FullD[1] then Color.green else Color.red));
#FullD.SetLineWeight(1);

#FullK.AssignValueColor(if FullK > FullK[1] then color.green else color.red);
#FullK.SetLineWeight(3);

#MdLn50.SetDefaultColor(GetColor(0));
#OverBought.SetDefaultColor(GetColor(1));
#OverSold.SetDefaultColor(GetColor(1));

def risingFullD = FullD > FullD[1];
def fallingFullD = FullD < FullD[1];
plot changeToUp = risingFullD and fallingFullD[1];
plot changeToDown = fallingFullD and risingFullD[1];


Attachments:
Marked as spam
Posted by (Questions: 1, Answers: 8)
Answered on August 19, 2017 12:50 pm
0
Private answer

Pete, after further testing, what I discovered that while the indicator on the chart “seems” not to line up perfectly, it does work well in scan mode. So I believe this will work. Thanks for your time. Enjoy the rest of your day.

Marked as spam
Posted by (Questions: 1, Answers: 8)
Answered on August 19, 2017 2:50 pm