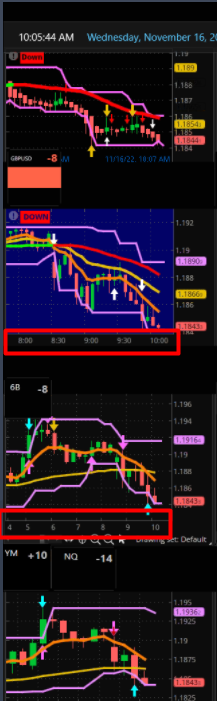
There are no settings to enable or disable this on Thinkorswim. If you have multiple charts stacked vertically in a grid as in your screenshot, the only thing preventing the time axis from showing is that you have run out of room. Either remove some of your charts or expand the size of the window to make room for the time axis.
The same exact thing will happen with lower studies. If Thinkorswim runs out of space to display elements, it starts removing them. But they come right back as soon as you adjust your chart grids to allow room for those elements to display.