| ♥ 0 |
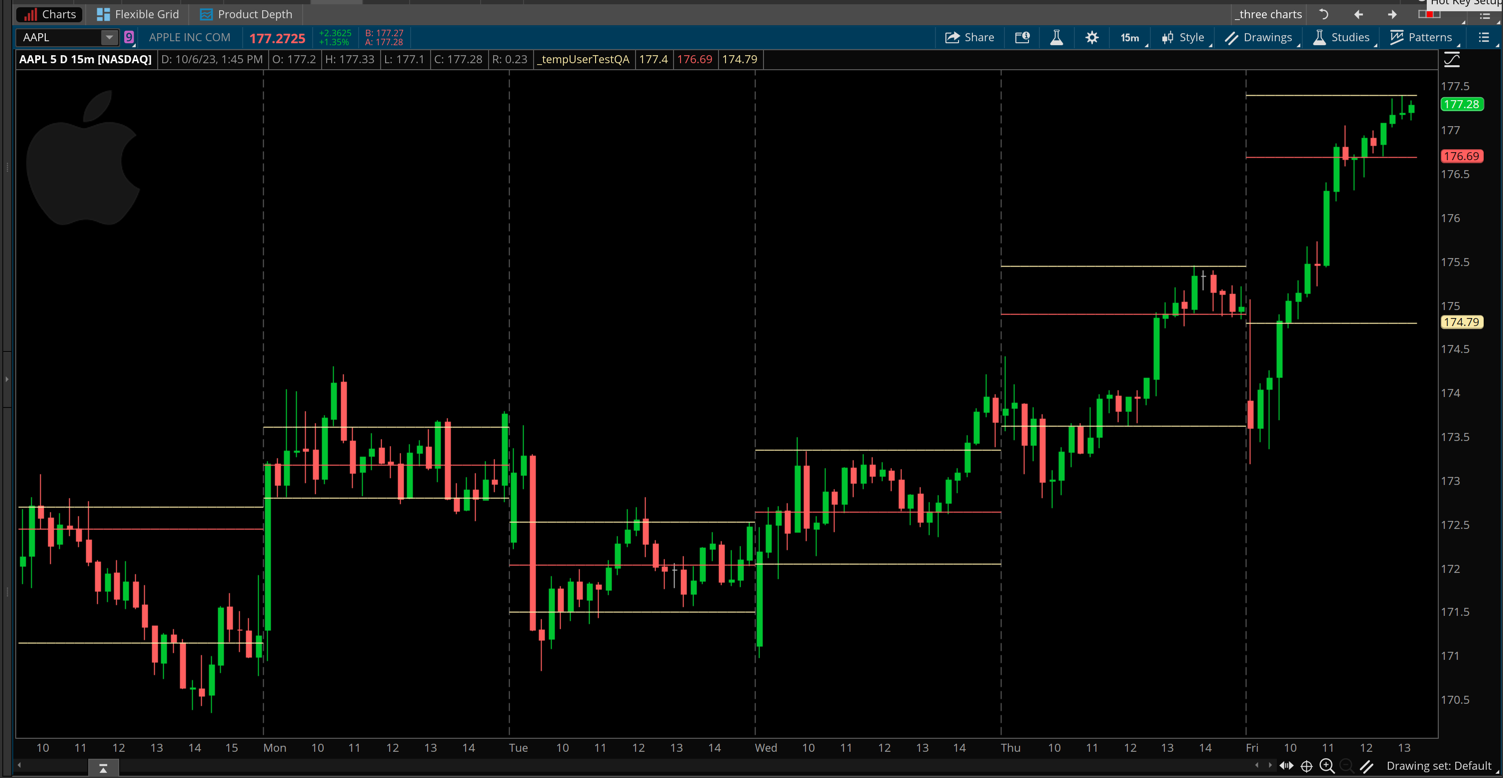
When using the TOS VolumeProfile study, is it possible to hide the volume figures? From the shape of the volume profile, it’s easy to see which prices had the most volume, so the actual numbers aren’t necessary, and just add clutter to the chart. Example of volume profile on /ES: Attachments:
Marked as spam
Asked on October 6, 2023 7:43 am
290 views
|
|
Private answer
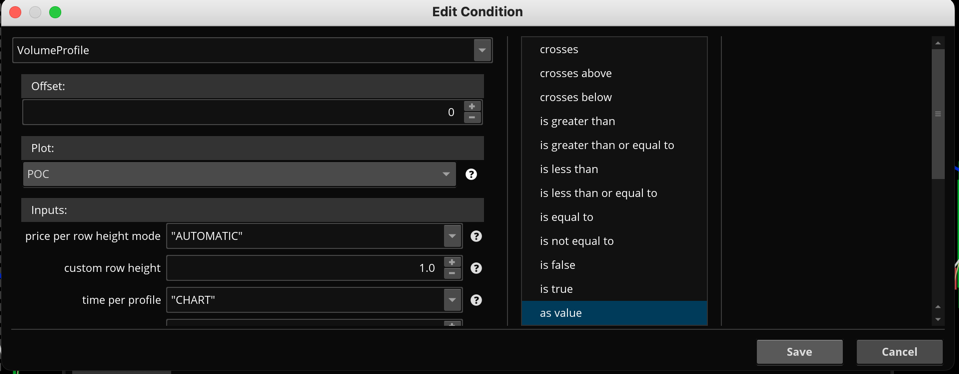
Those numeric values cannot be turned of on the Thinkorswim version of VolumeProfile. You can try adjusting the setting named "price per row height mode" to "TICKSIZE". This will sort of hide them on most chart time frames. But they are still there and you can view them if you expand the price range of the chart. Please note that changing that setting will also change the way the levels are computed. Another option is to create your own custom version of the VolumeProfile using techniques from the Condition Wizard. From the screenshot below you can see how I can create a custom chart study that displays only the POC plot from the VolumeProfile study. This is the code that is generated from that condition:
Please note, that is based on default settings. So be sure to adjust any parameters as needed before saving the condition. The following are a compilation of 3 separate conditions which you can combine together into one new chart study. I have adjusted some of the parameters so you can see how that impacts the code generated from the Condition Wizard. I have also added some style statements to make give the plots the same color and line style as the original:
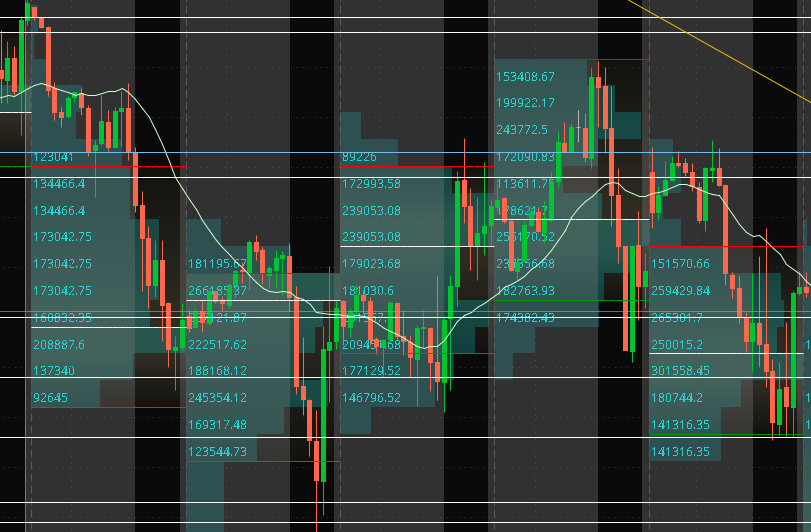
I have also included a screenshot showing how that looks on a chart. Would you like to know more about using the Condition Wizard tool on Thinkorswim? Be sure to check out the following videos: https://www.hahn-tech.com/thinkorswim-condition-wizard/ https://www.hahn-tech.com/thinkorswim-condition-wizard-watchlist/
Attachments:
Marked as spam
Answered on October 6, 2023 11:04 am
|