high-low range upper half of previous day range


Category:
0
0

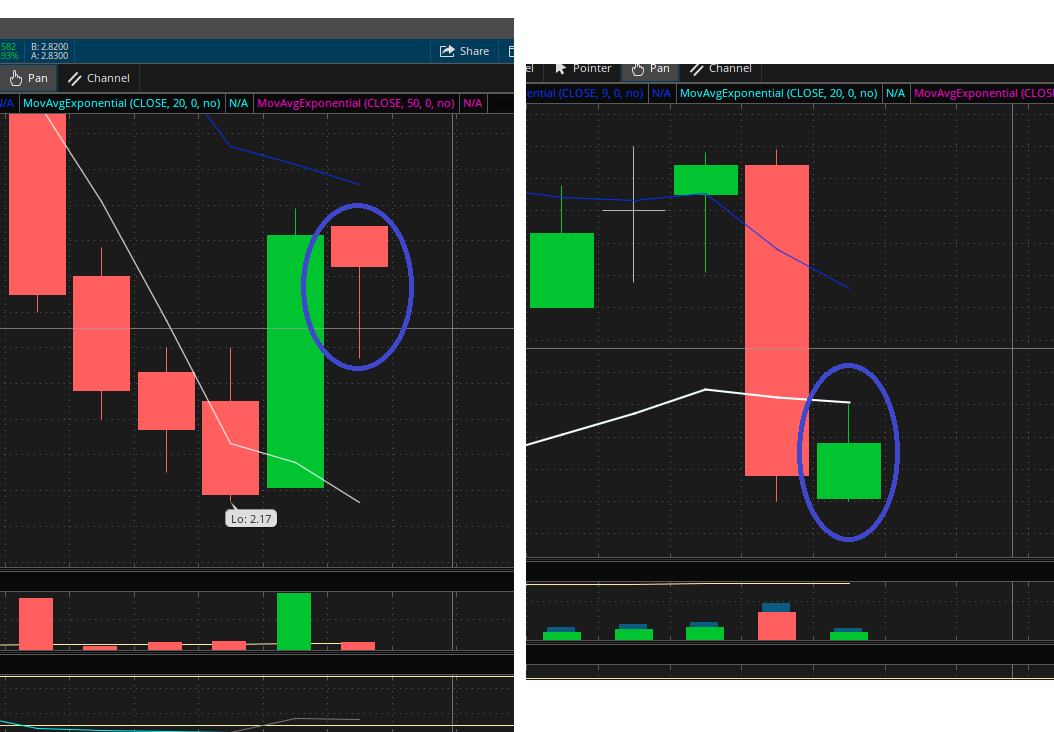
Hi Pete, I have a slightly complex question

I need to set a high-low range of the current day bar that will be in the upper half of the high-low range of the previous day, and vice versa.

I have attached a picture for illustration.

Thanks for the help!

Attachments:
Marked as spam
Posted by (Questions: 3, Answers: 2)
Asked on October 27, 2020 12:25 pm
81 views
0
Private answer

Pretty sure this has already been solved on at least one previous post. Did you try searching before posting a new question?

https://www.hahn-tech.com/ans/current-low-above-specified-percent-of-previous-bar-range/

Let me know if one of the previous solutions don't do exactly what you have requested here.

The only thing you need to add to the solution I linked above is a rule for the high being below the previous day's high. But you can build that with just a few clicks of the mouse using the Condition Wizard.

Marked as spam
Posted by (Questions: 37, Answers: 4086)
Answered on October 27, 2020 1:22 pm
0
Hi, the code helped me a lot with the bull pattern, but I got tangled up in making it fit the bear pattern I need (similar but inverted pattern) I would appreciate if I could get help! This is the code I was trying to use: input percentThreshold = 60.0; plot scan = high > low[1] - ((low[1] - high[1]) * percentThreshold * 0.01);
( at October 28, 2020 2:31 pm)
0
I have not tested this but I think this should work: input percentThreshold = 60.0; plot scan = high < high[1] - ((high[1] - low[1]) * percentThreshold * 0.01);
( at October 28, 2020 2:36 pm)
0
Yes, it resolved, thanks! I would love a small upgrade of the code, I want to set the low to be no lower than 1% of the low of 1 before. (To allow a small deviation of the bar) Thanks again
( at October 28, 2020 6:18 pm)
0
In the future, will need to provide the full set of specifications up front. As for this current post, I have already exceeded the time I permit to provide a solution.
( at October 28, 2020 7:01 pm)