| ♥ 0 |
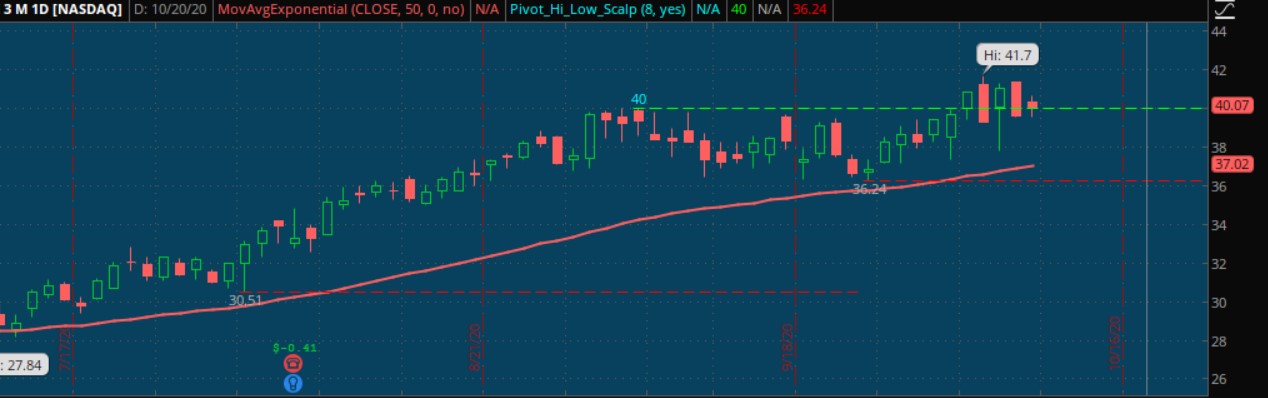
Hey Pete – I have an idea based on John Carter’s High of Low Period and Low of High Period (HOLP and LOHP respectively. I wasn’t able to find anything similar in the forums searching for “low candle” and “low period”. I have another study that is essentially how I’d like it to look, I’ll include a picture: The study would look back over the previous 20 bars and identify: HOLP: the lowest bar of the group, that is the bar with the lowest lows (Low-bar). The study would then add a green line at the high of that Low-bar, and the line would extend 10 bars forward. LOHP: the study would do the same thing, only with the low of the High-bar of the last 20 bars, and it would have a red line extending forward the same amount. Ideally, I would be able to turn off either LOHP or HOLP plots in the study settings so that I can toggle between using it in up/down trending markets. I looked at the code in the study that I already have for scalps (pictured) to see if I could re-write it, but I got in the weeds pretty quick. Any help is appreciated, thank you sir.
Attachments:
Marked as spam
Asked on October 10, 2020 1:39 pm
294 views
|