We can do this, but there is a catch. We can plot the line at the top or the bottom of the chart. But only if the chart is zoomed out so that every single bar is visible. As soon as you start to zoom in, you will loose sight of at least one of the lines, most likely both.
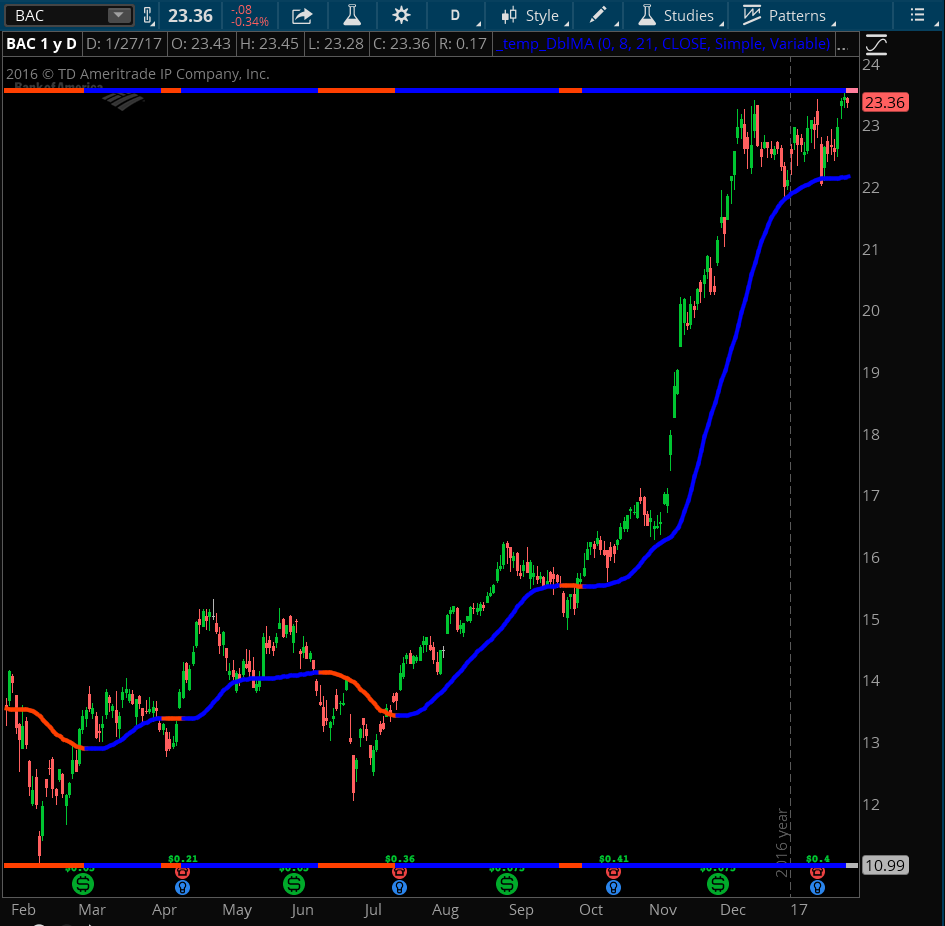
These are the statements you add to your code to plot the lines as shown on the attached:
#------------- get the chart's range based of viewable candles

plot chartRangeHigh = HighestAll(high);

chartRangeHigh.AssignValueColor(if DoubleMA > DoubleMA[1] then GlobalColor("RisingMA") else GlobalColor("FallingMA"));

plot chartRangeLow = LowestAll(low);

chartRangeLow.AssignValueColor(if DoubleMA > DoubleMA[1] then GlobalColor("RisingMA") else GlobalColor("FallingMA"));
A more stable solution would be to plot this horizontal line as a lower study. And to save space further, you could add it to a modified version of a lower study you already use. For instance you could add it as the Zero line of a momentum oscillator. Or you could add it as the 0% or 100% line of the RSI or Stochastic.
Here is you code, modified to plot the color coded horizontal line in a lower subgraph. You can add this to the code of a lower study you are already using, and adjust the value of plot chartRangeHigh = 0; to whatever level you want it to plot.
declare lower;

input displace = 0;

input MA1_length = 8;

input MA2_length = 21;

input price = close;

DefineGlobalColor("RisingMA", Color.Blue);

DefineGlobalColor("FallingMA", Color.Light_RED);

input movingAverageType1 = {default Simple, Exponential, Weighted, Hull, Variable};

input movingAverageType2 = {default Variable, Simple, Exponential, Weighted, Hull};

def data1;

switch (movingAverageType1) {

case Simple: data1 = CompoundValue(1, Average(price[-displace], MA1_length), price);

case Exponential: data1 = CompoundValue(1, ExpAverage(price[-displace], MA1_length), price);

case Weighted: data1 = CompoundValue(1, WMA(price[-displace], MA1_length), price);

case Hull: data1 = CompoundValue(1, HullMovingAvg(price[-displace], MA1_length), price);

case Variable: data1 = CompoundValue(1, VariableMA(price = price, length = MA1_length), price);

}

def DoubleMA;

switch (movingAverageType2) { case Simple: DoubleMA = CompoundValue(1, Average(data1[-displace], MA2_length), data1);

case Exponential: DoubleMA = CompoundValue(1, ExpAverage(data1[-displace], MA2_length), data1);

case Weighted: DoubleMA = CompoundValue(1, WMA(data1[-displace], MA2_length), data1);

case Hull: DoubleMA = CompoundValue(1, HullMovingAvg(data1[-displace], MA2_length), data1);

case Variable: DoubleMA = CompoundValue(1, VariableMA( data1, MA2_length), data1);

}

#------------- get the chart's range based of viewable candles

plot chartRangeHigh = 0;

chartRangeHigh.AssignValueColor(if DoubleMA > DoubleMA[1] then GlobalColor("RisingMA") else GlobalColor("FallingMA"));
I edited your post to include the code you originally sent to my email. I wanted to make sure the post contained the complete context of what you are trying to accomplish. I will provide a response to this question tomorrow.