Inside Days – Entry prices on Chart


Category:
0
0

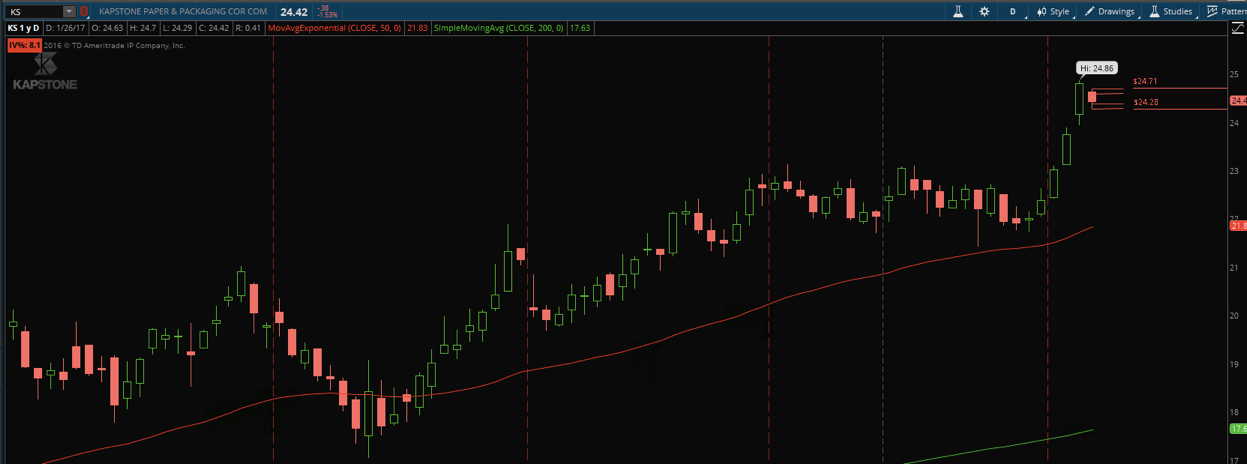
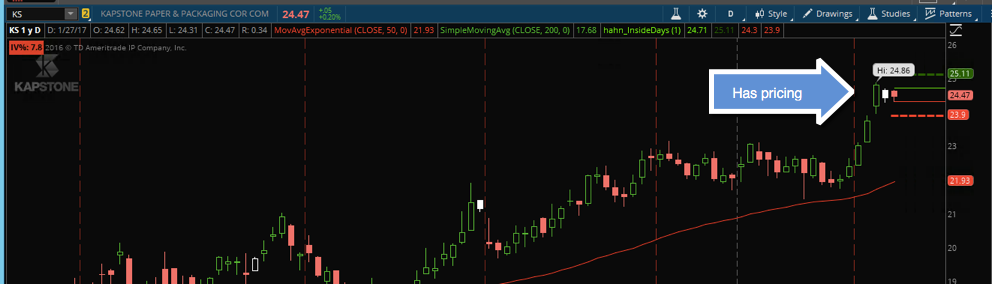
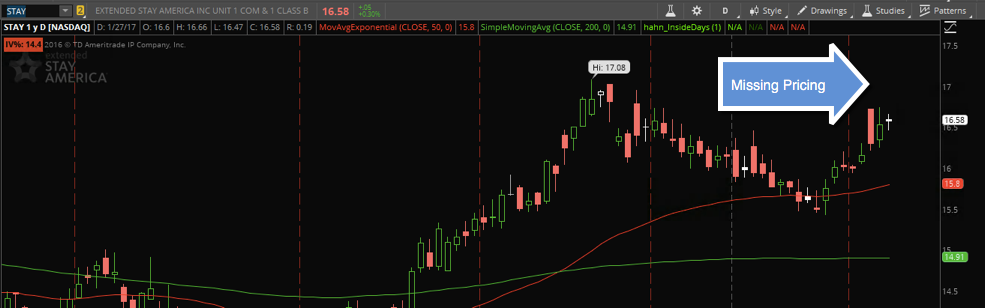
Hi Everyone,

I’ve created a scanner for Inside Days as a setup for trades.  I have the scanner thinkscript code pasted below.  But I’d really like to have the entry and exit visually on the chart (more below).  First, for those unfamiliar with Inside Days here’s a definition from Investopedia.

“An inside day is often used to signal indecision because neither the bulls nor the bears are able to send the price beyond the range of the previous day. If an inside day is found at the end of a prolonged downtrend and is located near a level of support, it can be used to signal a bullish shift in trend. Conversely, an inside day found near the end of a prolonged uptrend may suggest that the rally is getting exhausted and is likely to reverse.” -Investopedia

Here’s the code…

—>>

def count = 2;
def range = high – low;
def priorrange = high[1] – low[1];
def nibsize = absvalue(((open – close) / (open[1] – close[1])-1));
def inside_bar = if absvalue((range / priorrange)-1) >= .5 and nibsize >= .5
then high <=high[1] and low >= low[1] else double.nan;
plot s = inside_bar && lowest(range,count);

<<<—-

The above code is used in the scanner – and for the most part works good.  But I’d like advice from anyone on how to get the entry prices onto a 1yr/d chart?   It would be uber cool to have an entry and exit price for the trade for the next day (both long and short).  I’ve attached an example – where the last candle of the day (aka the inside day) will have a price of the high + a penny and the low – a penny.  These are long / short entry points for trades on the next day (Market stop).  In fact, it should recommend the trend i.e. long or short.

In the attached chart, I’ve used KS as an example from Jan 25, 2017 – the ask is to have the long entry position ($24.71 in this example) and the short entry position ($24.28) visually show on the chart.  This done manually using the drawing tool / channel and price level in the example.  In this example, I’d be going short on the entry on this because the RSI hit an all time high and is moving down and every time it has the stock has come off.

A ‘nice to have’ on the chart is the long / short LIMIT (to take your profits) price.  This is where you exit the trade (depending on your risk tolerance).  So in the example, the spread is 24.70 – 24.29 or $0.40 (rounding) making the long profit exit 25.11 and the profit exit short 23.87 (the stops are another subject altogether but generally are the entry price for the opposite side of the order, e.g. the short stop is 25.11 and the long stop is 23.87 – but I like to add a buffer of 0.05 so I don’t get stopped out too soon).

I think I have the scanner logic coded for the ‘inside day’s’ range to be 50% or less of the previous bar’s body (the last bar should be half the size of the prior bar).  This will reduce the risk for the trade – you want some room so that the professional traders don’t flush you out, hitting your stop before the trade goes higher (it happens at the start of the trading day… you don’t want to put your stop on too early).  I say I think… because I’ve come across a few outliers that don’t look like they’re 50% smaller than the prior day… so any help on the code would be greatly appreciated.

Trade with confidence….

Stuart


Attachments:
Marked as spam
Posted by (Questions: 1, Answers: 3)
Asked on January 26, 2017 10:28 pm
2523 views
0
Private answer

Great post Stuart! You provided a working code sample and screen shot to clarify your point. I probably spent way to much time on this but I had some hurdles to leap in order to get the levels to project into the right expansion area of the chart. I have left off the labels, because all we have available is Chart Bubbles. And those can often clutter up the chart.

In this code I have set the default behavior to plot only if the previous bar was an inside bar. For demonstration purposes, I felt it would provide a clearer picture of how the levels would be applied to a trade. Just change the offset input to zero to have it plot when the inside bar is the current candle.

I cleaned up the code a bit. When plotting your signal, there were several N/A’s. Now it shows either a zero or a 1, which is ideal for running scans. I’ll post both scripts. The scan can be set to look for current inside candles or previous insides candles. Just change the inside_bar[0] to inside_bar[1] or some other number to go back in history.

This is the one for running scans:
def count = 2;
def range = high – low;
#def priorrange = high[1] – low[1];
def priorrange = range[1];
def nibsize = absvalue(((open – close) / (open[1] – close[1])-1));
def sizeConstraint = absvalue((range / priorrange)-1) >= .5 and nibsize >= .5;
def hiLowContraint = high <=high[1] and low >= low[1];
def inside_bar = sizeConstraint and hiLowContraint;
#plot s = inside_bar && lowest(range,count);
plot scan = inside_bar[0];
AssignPriceColor(if inside_bar then Color.WHITE else Color.CURRENT);

This is the one for plotting on the chart:


input offset = 1;
#def count = 2;
def range = high – low;
#def priorrange = high[1] – low[1];
def priorrange = range[1];
def nibsize = absvalue(((open – close) / (open[1] – close[1])-1));
def sizeConstraint = absvalue((range / priorrange)-1) >= .5 and nibsize >= .5;
def hiLowConstraint = high <=high[1] and low >= low[1];
def inside_bar = sizeConstraint and hiLowConstraint;
rec insideBarRange = CompoundValue(1, if inside_bar then range else insideBarRange[1], Double.NaN);
#plot s = inside_bar && lowest(range,count);
def plotRightExpansionArea = !IsNaN(close[1]) and IsNaN(close[0]);
rec longEntry = CompoundValue(1, if plotRightExpansionArea[-1] then if inside_bar[offset] then high[offset] + 0.01 else Double.NaN else longEntry[1], Double.NaN);
rec longExit = CompoundValue(1, if plotRightExpansionArea[-1] then if inside_bar[offset] then longEntry + insideBarRange else Double.NaN else longExit[1], Double.NaN);
rec shortEntry = CompoundValue(1, if plotRightExpansionArea[-1] then if inside_bar[offset] then low[offset] + 0.01 else Double.NaN else shortEntry[1], Double.NaN);
rec shortExit = CompoundValue(1, if plotRightExpansionArea[-1] then if inside_bar[offset] then shortEntry - insideBarRange else Double.NaN else shortExit[1], Double.NaN);
plot longEntryLevel = longEntry;
longEntryLevel.SetDefaultColor(Color.GREEN);
plot longExitLevel = longExit;
longExitLevel.SetDefaultColor(Color.DARK_GREEN);
longExitLevel.SetPaintingStrategy(PaintingStrategy.DASHES);
longExitLevel.SetLineWeight(3);
plot shortEntryLevel = shortEntry;
shortEntryLevel.SetDefaultColor(Color.RED);
plot shortExitLevel = shortExit;
shortExitLevel.SetDefaultColor(Color.RED);
shortExitLevel.SetPaintingStrategy(PaintingStrategy.DASHES);
shortExitLevel.SetLineWeight(3);
AssignPriceColor(if inside_bar then Color.WHITE else Color.CURRENT);

Attachments:
Marked as spam
Posted by (Questions: 37, Answers: 4084)
Answered on January 27, 2017 12:28 pm
0

Love, love, love it…. ?

( at January 27, 2017 1:54 pm)
0

Hi Pete, I have found this post very useful, and the codes works perfectly thank you. I just have a quick question with regards to using this scan on the hourly time frame. I have changed aggregation period from D to 1H, however thinkorswim uses the top of the hour when scanning, for example (9:00-10:00), I am wondering if there is a way to scan the 1H time frame on the bottom of the hour for example (9:30-10:30, 10:30-11:30) etc. The chart is able to do this by turning on “start aggregation at market open” option, however this does not effect how the scan is done.

Any help would be greatly appreciated.
thank you.

( at February 11, 2019 2:56 pm)
0
I have a lot of inside days and the entries are not showing up
( at April 9, 2021 7:30 am)
0
Private answer

Awesome!  Pumped to try it.   I’ll keep you posted.

S.

Marked as spam
Posted by (Questions: 1, Answers: 3)
Answered on January 27, 2017 1:26 pm
0
Private answer

Hi Paul,

Lots of awesome work on this! One small issue… the entry/exit prices appear on the chart when there is a bar to the right of the inside day but do not appear when there isn’t a bar to the right.

I have posted two examples the first one is KS (continues the thread) it works perfectly because there is “today’s” bar and then the ‘inside day’ (yesterday’s bar).

The second example – ‘STAY’ has today’s inside bar (uber awesome that it is shown in white, so smart) however, it doesn’t show the enter/exit prices.

Any suggestions on how to get the prices showing when there isn’t a bar in between?

Attachments:
Marked as spam
Posted by (Questions: 1, Answers: 3)
Answered on January 27, 2017 2:45 pm
0

Quote from my original answer:
”Just change the offset input to zero to have it plot when the inside bar is the current candle.”

( at January 27, 2017 7:26 pm)
0

Sorry Paul, missed the ”offset input” when I first read it… I was looking for inside_bar[0] – my bad.

Tried it and it works great!

?

( at January 30, 2017 9:10 pm)