Hourly Watchlist Indicator Issue


Category:
0
0

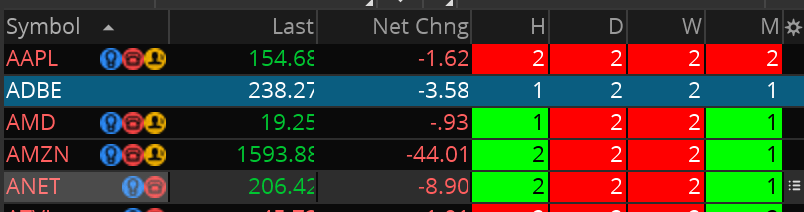
Hi Pete, big thanks for all the info you provide on the TOS platform as I’ve found it super helpful. I’m trying to create a watchlist column for an hourly timeframe that shows me the type of candle and whether the price is increasing or decreasing. The code below works great on daily, weekly, monthly, etc timeframes but I provides inaccurate data for anything shorter than a day. Do you have any hints or ideas on what I’m doing wrong? I’ve included an example screenshot.

<code>

plot CandleType;
if high[0] > high[1] and low[0] < low[1] then {
#engulfing
CandleType = 3;
} else if high[0] < high[1] and low[0] > low[1] then {
#inside
CandleType = 1;
} else {
#directional
CandleType = 2;
}

plot CandleDirection;
if close[0] > open[0] then {
#Price is rising
CandleDirection = 1;
} else if close[0] < open[0] then {
#Price is declining
CandleDirection = 2;
} else {
#price is unchanged/not used
CandleDirection = 3;
}

addLabel(yes, if CandleType == 3 then “3” else if CandleType == 1 then “1” else “2”, if CandleDirection == 2 then color.white else if CandleDirection == 1 then color.black else color.white);

assignBackgroundColor(if CandleDirection == 1 then color.green else if CandleDirection == 2 then color.red else color.yellow);

</code>

Attachments:
Marked as spam
Posted by (Questions: 1, Answers: 1)
Asked on January 29, 2019 2:50 pm
127 views
0
Private answer

Check your chart settings. There is a setting named “start aggregation at market open”. The default value is checked. You must uncheck this before your charts will align with any of the other tools on the platform when working with intraday time frames. This question has been posted before. Screenshot below shows where to locate the setting.

Attachments:
Marked as spam
Posted by (Questions: 37, Answers: 4086)
Answered on January 30, 2019 10:36 am
0

Thank you sir

( at January 31, 2019 1:03 pm)