| ♥ 0 |
I downloaded and installed the indicator from your site. Basically I would like to see the past history of trigger alerts when setting study alerts on the graph, like in your Youtube video. The downloaded indicator shows up on my normal trade charts. I also expanded the window to view the plot charts. Attachments:
Marked as spam
Asked on August 2, 2018 5:06 am
168 views
|
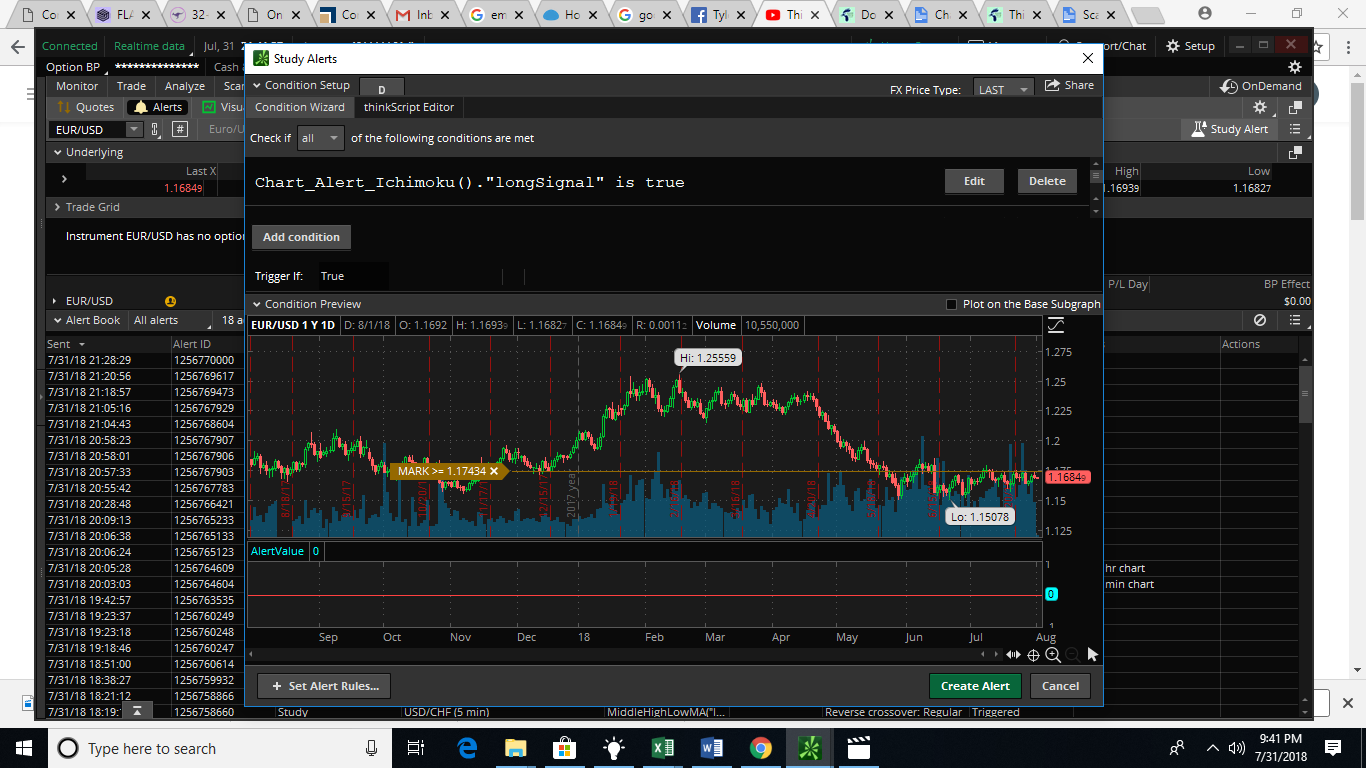
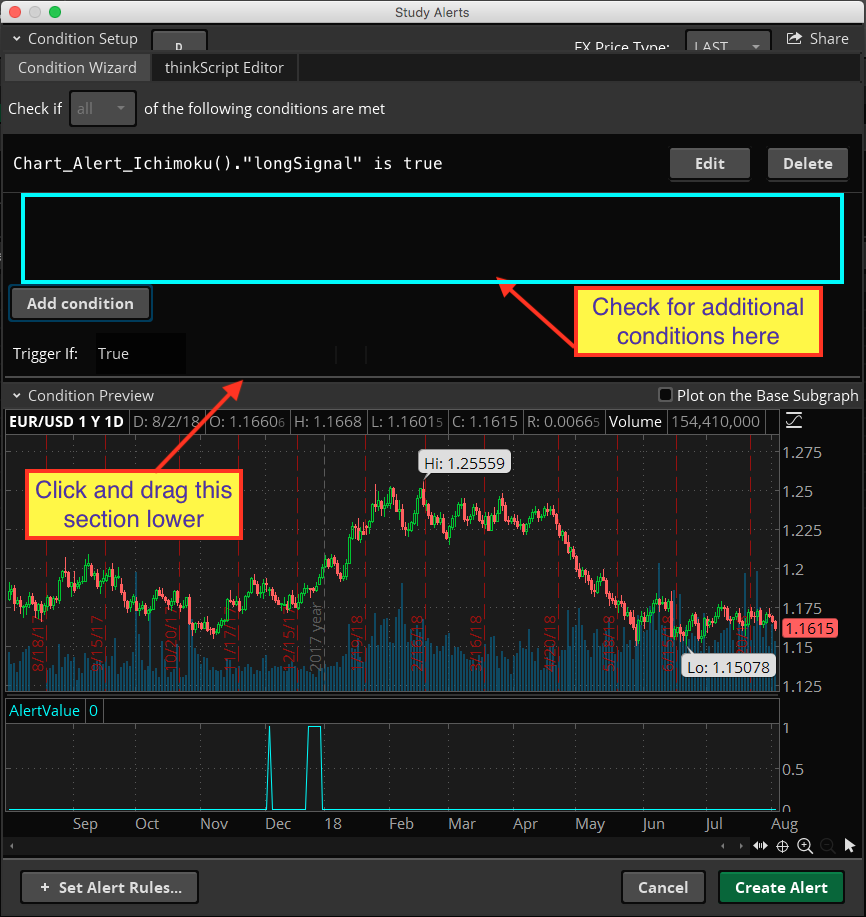
You were right about having more than one condition open and I turned the others off, like you said to do. However I still see no Ichmoku indicator on the chart. I do not know what else you want a screen shot of. Maybe you want a shot of the condition setup, but I already checked to see if all the settings match yours in the Youtube video.