Based on the details you provided it seems you are lost in the weeds on this one. I feel for you because I've been there. I am going to try to help you understand things more clearly. The question you answered was the wrong question to ask. Here is the original title you entered for your question:
Can I get the actual pixel height of a bar?
After reading your question several times I believe I understand what you are trying to do. But it would be the wrong approach to take because it would create trade entry signals which do not exist in the real world. And when it comes to back-testing and triggering entry/exit points the most important detail to get correct is that it should be based on values which exist in reality.
That's the summary, now here is the detail to unwrap those concepts so you understand it more clearly:
- It is impossible to read the "pixel height" of any element on a chart from within a custom chart study on Thinkorswim. Those metrics are not visible to the Thinkorswim language.
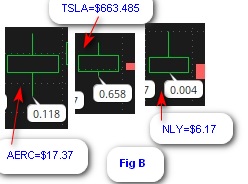
- When you apply the Heiken-Ashi style to your chart it is adjusting the open, high, low and close of each candle. What you see on the chart is no longer the same as the underlying chart data.
- A consequence of this is this you should NEVER try to execute trades or perform back-testing based on HA prices crossing any other elements on the chart.
- On a HA chart, trades are not actually taking place at the prices of those candles. The candles have been modified according to the rules of Heiken-Ashi. They are only useful to identifying directions in trends, nothing more.
- This adjustment does not impact the built-in price types so when you use "close – open" you are reading the values of the original candles and NOT the HA candles. Once you switch the chart to HA candles you can no longer measure candle body height using "close – open". It will always be correct, but it will never match the candles on the HA chart.
Sorry but that is the best I can do in the very brief amount of time I can afford for free solutions in this forum. I sense that you will need a great deal more to fully understand this and avoid creating a tool with no basis in reality. Which is one of the most dangerous pitfalls for traders to fall into.
Here is some code to compute the Heiken-Ashi candles. This has been published numerous times on this forum so if you are interested in learning various methods of applying this I encourage to use search this forum using the term "heiken-ashi" and browse existing solutions.
def haClose = ohlc4;

def haOpen = if haOpen[1] == 0 then haClose[1] else (haOpen[1] + haClose[1]) / 2;

def haHigh = Max(high, Max(haClose, haOpen));

def haLow = Min(low, Min(haClose, haOpen));
You can add plot statements to the code to display those values on the chart. Then change your chart to display normal candles. This will show you how the HA adjusted candles differ from the true candles which are being traded in real life. The differences may be subtle, but the consequences of doing this wrong can be very harmful.