How to create an offset Probability Of Expiring Cone


Category:
0
0

Some place I saw a free thinkscript for an offset Probability Of Expiring Cone indicator, but for the life of me, I cannot find it again to get it. Therefore, I was wondering if you could help with this. Below is the thinkscript that I have been trying but it does not work. Basically what I want to be able to do is to have the cone displaced back in time by a variable but set number of days. Thus, what did this cone look like 10 days ago for example. I greatly appreciate your help in this matter!

declare real_size;

input period = 30;
input prob_range = 68;

input displace = 0;

plot UpProbExp = Double.NaN -displace;
plot DownProbExp = Double.NaN-displace;

Marked as spam
Posted by (Questions: 15, Answers: 23)
Asked on December 1, 2017 9:46 pm
1350 views
1
Private answer

Hi Pete. Thanks yet something is not quite right. If one was to go to the probability of in the money on the trade tab and record the strikes at a positive delta 30 and negative delta 30 (for example); then compare that with the equivalent 10 days later the probability cone would potentially show something drastically different (as long as the stock is not just going sideways). The value of this calculation can be incredible as the options statistics of 10 days, or 2 weeks, or a month ago does come into play! For example, most stocks only move 1 standard deviation on average per month (delta 30 positive/negative). However, during the course of the month it is not uncommon to see stocks move more than 1 standard deviation, yet by expiration they often come back that range. Thus, the indicator that I had seen looked similar to the one that you have on the left, yet it was calculated based on the probability of 10 days ago, not today’s.

Marked as spam
Posted by (Questions: 15, Answers: 23)
Answered on December 5, 2017 4:10 pm
0

responding in the comments section of your last answer….
Thanks for explaining things in detail. In no way were my statements meant to indicate there was no value in applying historical ProbExp levels to current price action. You have confirmed this indicator does not, which is the point I was wanting to emphasize. So we are in full agreement.
The source code for this indicator is not available because Thinkorswim has hidden it. Very likely the code for this uses some language elements not available to the general public (it’s not a licensed study yet the source code is hidden). I cannot imagine how one could build an indicator you describe using publicly available language elements in the Thinkscript library.

In fact, I could not even get the built in study to plot using OnDemand looking back 10 days. So the data to compute historical ProbExp levels may not even exist in Thinkorswim.

( at December 6, 2017 8:41 am)
0

Regarding: How to create an offset Probability Of Expiring Cone

I actually see this as a valuable tool if it can be created. The input should ask for a date to relocate the cone back in time. The cone should then be recalculated up to that date. So, it would not be the current date cone simply relocated.

Here’s why this is important:
The new cone tool would enable the user to visually back-test select option trades, For example, lets say I want to sell a 115 PUT (15 delta) in STMP on 1/30/18 with 45 days until 16MAR18 expiration. While you can find this data in Thinkorswim thinkback, it takes a lot of time to check for the 15 delta strike and then check to see if price touched that level, in the case 115, over the next 45 days.

A new cone tool would save a lot of back-testing time by allowing the cone to be dragged around on the chart and recalculating the cone on the selected historical date.

Thanks for your consideration.
John

( at June 30, 2018 1:00 pm)
0

Thanks for the input John. I agree. However it’s impossible to program given available tools in Thinkorswim. So your only recourse is to submit a request to TD Ameritrade to have their programers build this into the platform.

( at June 30, 2018 1:32 pm)
0
Private answer

If I understand correctly, you cannot achieve what you have described. Yes, you can ‘shift’ or ‘displace’ any plot on the chart by just about any number of bars. (the calculated values remain unchanged). So in the case of the ProbabilityOfExpiringCone, you are not going to “see the cone as it was 10 days ago”. You are going to see the same exact cone from today’s computations, displaced a specified number of bars.

Marked as spam
Posted by (Questions: 37, Answers: 4090)
Answered on December 2, 2017 9:31 am
0
Private answer

Ok. How would that be accomplished on the ProbabilityofExpiringCone that comes standard on TOS since it does not have a displaced setting? It only has a period and probability range. I have to set the period with a negative value and then nothing is displayed on the chart.

Marked as spam
Posted by (Questions: 15, Answers: 23)
Answered on December 5, 2017 1:40 pm
0
Private answer

When you have additional questions to add please do so in the comments section of my previous answer. When you post a new question using the box set aside for new answers it will confuse everyone trying to find the solution.

There is a very deliberate reason that TOS programers did not include a displacement input on this study. And that is because it has absolutely no value whatsoever. 

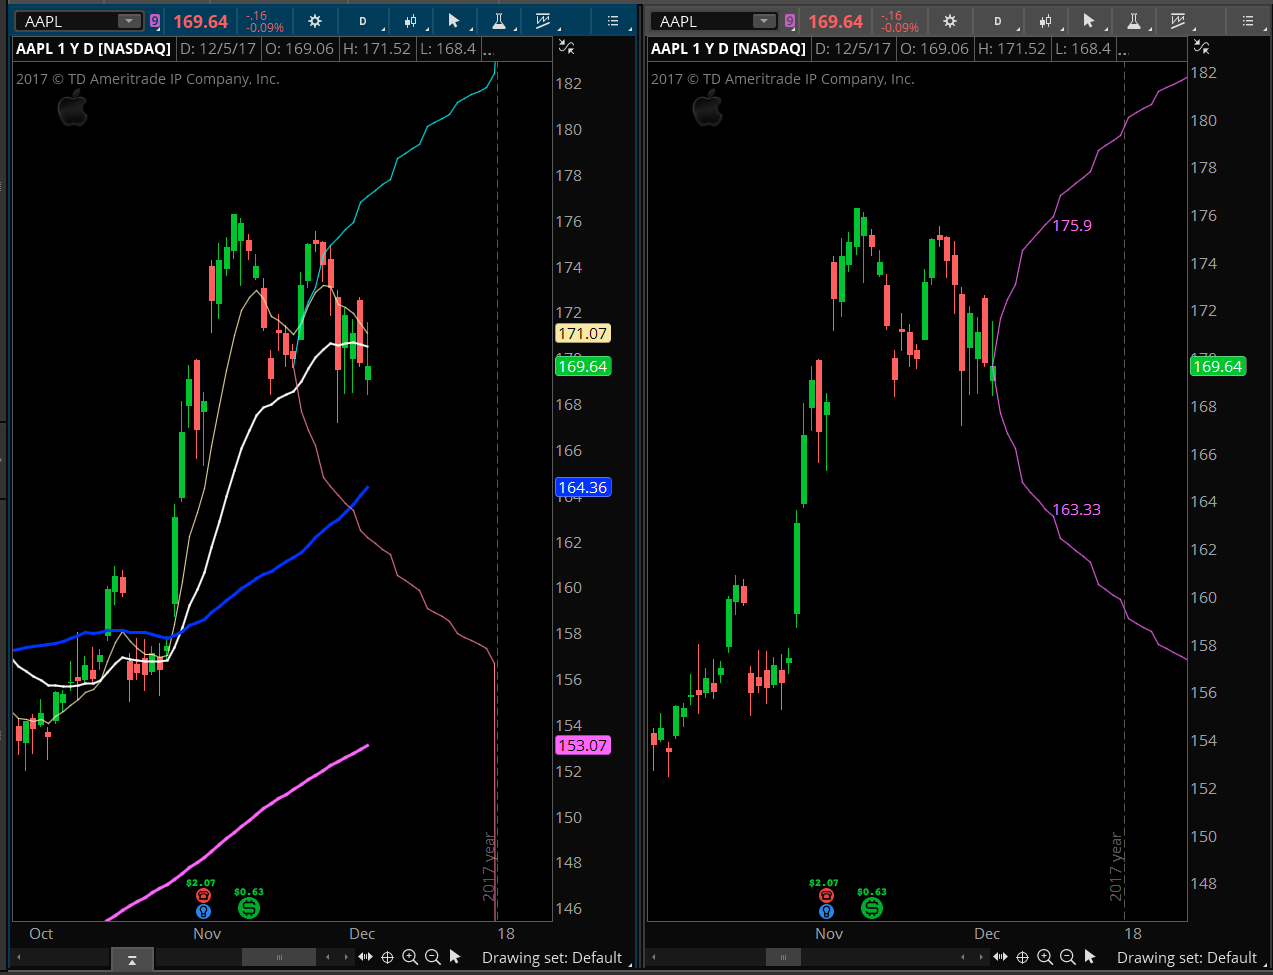
As I stated previously, it is possible to displace any plot by using a negative index value in the plot statement. HOWEVER this does not change the computed values. Attached screenshot shows two charts side by side. The one on the left is created using the code I am posting in this answer. The chart on the right contains the original code.

I see absolutely no value in using this. The cone on the left is the exact same cone as on the right. Both cones are based on TODAY’s options pricing. The one on the left is NOT based on options pricing from 10 days ago. The one on the left DOES NOT represent the expected probability of expiration in ANY WAY WHATSOEVER. I must emphasize this to warn other viewers encountering this post and trying to make something out of it. There is nothing here.

Here is your code:

input period = 100;
input prob_range = 68;
def upperLine = ProbabilityOfExpiringCone(period, prob_range).UpProbExp;
def lowerLine = ProbabilityOfExpiringCone(period, prob_range).DownProbExp;
plot topOfCone = upperLine[-10];
plot bottomeOfCone = lowerLine[-10];

Attachments:
Marked as spam
Posted by (Questions: 37, Answers: 4090)
Answered on December 5, 2017 2:23 pm
0
Private answer

I found a picture of what it is supposed to look like. If that helps for developing a code for this.


Marked as spam
Posted by (Questions: 15, Answers: 23)
Answered on December 12, 2017 5:45 am
0
Private answer

The picture is attached.

Marked as spam
Posted by (Questions: 15, Answers: 23)
Answered on December 12, 2017 5:49 am
0

Your responses with additional information would be so much more readable if you had placed them in the comments section of my original answer. This response I am typing now, is in the comments section of a new answer you added on Dec 12th. Please learn to use the comments section. This entire thread has become very difficult for other readers to follow.

( at December 12, 2017 8:21 am)
0
Private answer

As I do more searching, I have been able to find a premium version of it, yet I’m positive that when I originally saw it, it was free. Either way, I understand; sorry for the inconvenience. Thank you for your time.

Marked as spam
Posted by (Questions: 15, Answers: 23)
Answered on December 12, 2017 6:17 am