How to display volume number above price candle on TOS chart


Category:
0
0

How can I get volume to display above a price candle on any chart? I will use this primarily for SPX but might use it on other charts. Attached is a screenshot that shows the intended result of volume numbers shown in blue above each candle. Thank you!

Attachments:
Marked as spam
Posted by (Questions: 3, Answers: 0)
Asked on April 26, 2020 8:57 am
660 views
0
Private answer

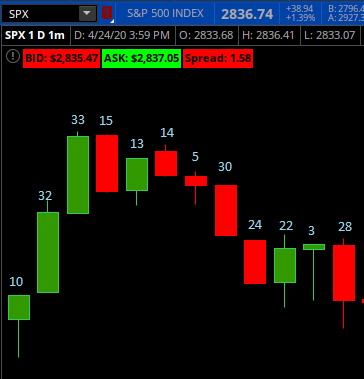
First thing to mention is that SPX does not have any volume data. So whatever is being displayed on that screenshot you provided it is not volume for the ticker symbol loaded on that chart. Given the very small values displayed I also doubt that is volume from any particular ticker symbol at all.

However what you requested was how to display volume as values above the candles. So that's what we'll provide:

plot data = volume;
data.SetPaintingStrategy(PaintingStrategy.VALUES_ABOVE);

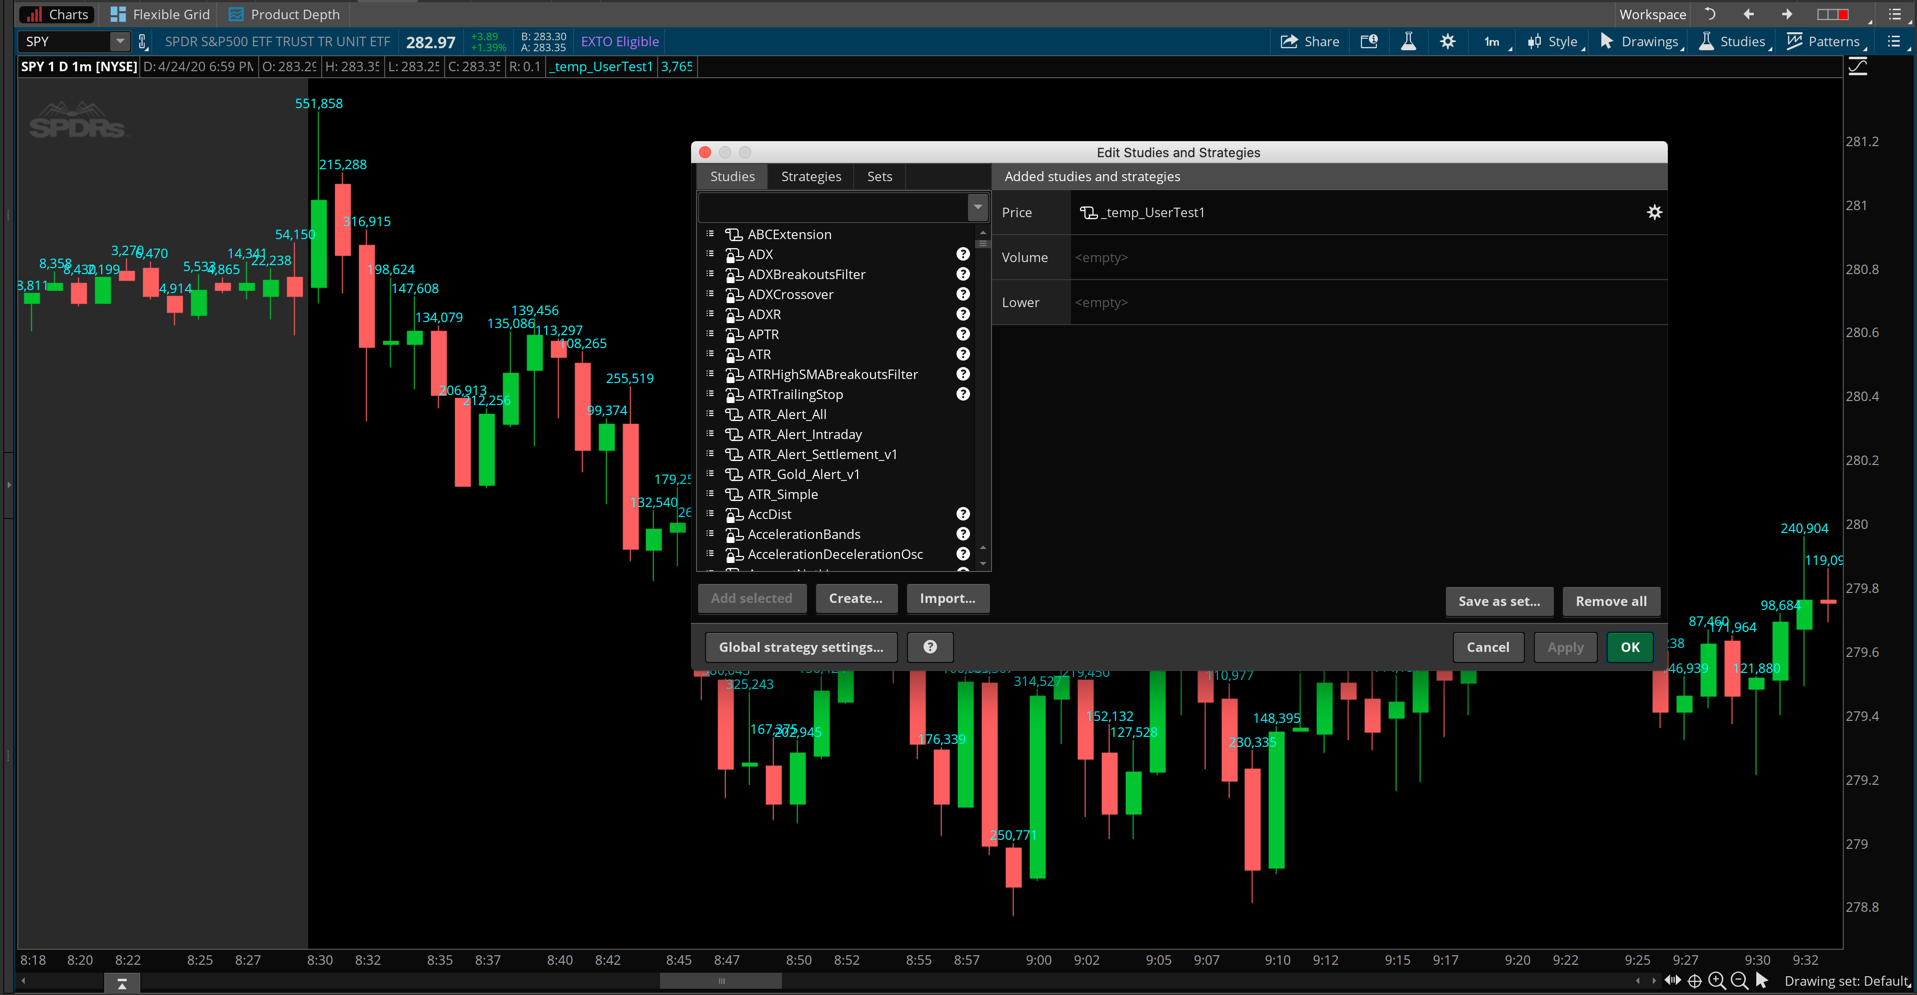
When you add this to a new chart study and apply it to the chart the platform will place that on the volume subgraph. So you will need to click and drag that study to the upper subgraph to get it to display on the candles of the price graph. I am including a screenshot so that you can see where the custom study must be moved.

Notice in my screenshot I have selected the ticker symbol SPY, because that is a similar instrument to SPX except that SPY does include volume data.

Attachments:
Marked as spam
Posted by (Questions: 37, Answers: 4087)
Answered on April 26, 2020 9:27 am
0
is it possible to tweak the code where I can only see high volume values on the corresponding candlesticks? for example, I only want to see volume of 5 million or more, when it hits that number it would show up on the corresponding candlestick. would really appreciate it if you can help thanks in advance
( at December 4, 2021 3:16 pm)
0
Change the following line: plot data = volume; .... to this: plot data = if volume > 5000000 then volume else Double.NaN;
( at December 4, 2021 10:33 pm)
0
Hi Pete, Thank you being gracious in sharing your skills. Quick question is there a way I can only identify the candle with 60 Million+ volume without displaying the actual volume number over the candle? i.e. maybe an arrow over the candle to identify that candle. Also would I be able to show it only on the 30 minute chart? Thanks again
( at September 8, 2022 12:18 pm)
0
The solution in this post is cannot be made to do what you are asking. The closest solution we have published is based on dollar volume. Which you may be able to adapt to fit your preferences: https://www.hahn-tech.com/ans/mark-candle-based-on-dollar-volume/
( at September 8, 2022 2:59 pm)
0
If you cannot adapt that solution to fit your preferences you may consider posting a new question. However I do try to discourage folks from requesting solutions which use a fixed value, such as 60 million. Such solutions have a very limited scope and will not be useful to the vast majority of our viewers. You should consider a solution which will flag the high volume bars but do so in a way that will automatically adapt to all stocks. Get the idea? We don't want to build a solution that only works for the one stock in the entire universe for which 60 million shares is the trigger. You should think about incorporating a moving average of the volume and have the chart study mark candles which exceed that average volume by a specified percent.
( at September 8, 2022 3:04 pm)