Hi, Pete,
Hope all is well with you.
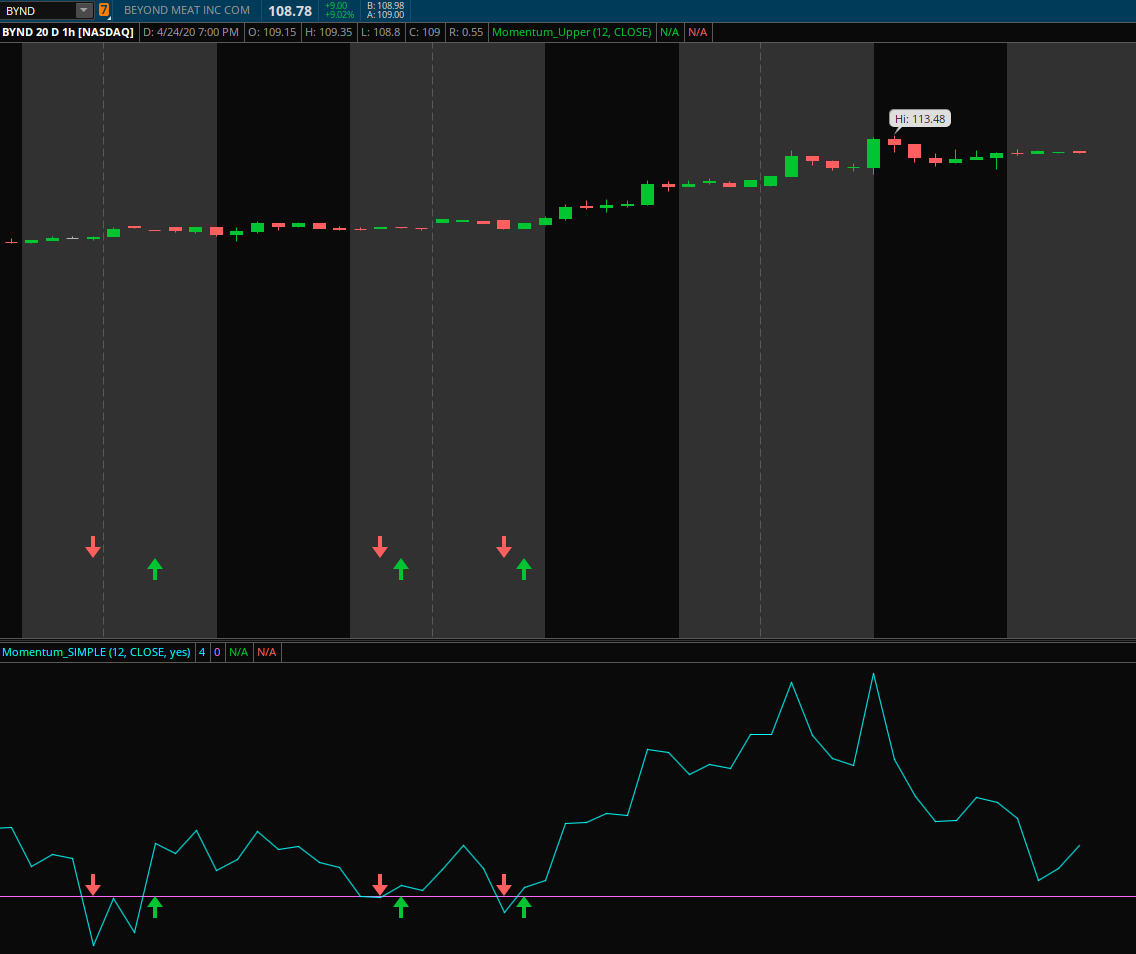
I was thinking that maybe it would be a better idea to transform this into a superior study so that the arrows can be clearly marked on the graph. But I have a problem with the graph. The sails are flattened and the signal arrows are at the bottom of the table. Do you have any ideas on how to fix this?
Code lower:
#—–Momentum
Declare lower;
input length = 12;
input price = close;
input showBreakoutSignals = no;
Assert(length > 0, “‘length’ must be positive: ” + length);
plot Momentum = price – price[length];
plot ZeroLine = 0;
plot UpSignal = if Momentum crosses above ZeroLine then ZeroLine else Double.NaN;
plot DownSignal = if Momentum crosses below ZeroLine then ZeroLine else Double.NaN;
UpSignal.SetHiding(!showBreakoutSignals);
DownSignal.SetHiding(!showBreakoutSignals);
Momentum.SetDefaultColor(GetColor(1));
ZeroLine.SetDefaultColor(GetColor(0));
UpSignal.SetDefaultColor(Color.UPTICK);
UpSignal.SetPaintingStrategy(PaintingStrategy.ARROW_UP);
DownSignal.SetDefaultColor(Color.DOWNTICK);
DownSignal.SetPaintingStrategy(PaintingStrategy.ARROW_DOWN);
# Alerts
Alert( UpSignal, ” “, Alert.BAR, Sound.RING);
Alert(DownSignal, ” “, Alert.BAR, Sound.RING);
…. and the other one is the code I tried to convert to upper study.
#---Momentum_Upper

input length = 12;
input price = close;

Assert(length > 0, "'length' must be positive: " + length);

def Momentum = price - price[length];
def ZeroLine = 0;

plot UpSignal = if Momentum crosses above ZeroLine then ZeroLine else Double.NaN;
UpSignal.SetDefaultColor(Color.UPTICK);
UpSignal.SetPaintingStrategy(PaintingStrategy.ARROW_UP);

plot DownSignal = if Momentum crosses below ZeroLine then ZeroLine else Double.NaN;
DownSignal.SetDefaultColor(Color.DOWNTICK);
DownSignal.SetPaintingStrategy(PaintingStrategy.ARROW_DOWN);

# Alerts
Alert( UpSignal, " ", Alert.BAR, Sound.Ring);
Alert(DownSignal, " ", Alert.BAR, Sound.Ring);
Enclosed is screenshots as an example.I am waiting for your response. Thank you!