How to draw a line parallel to LinearRegChVar


Category:
0
0

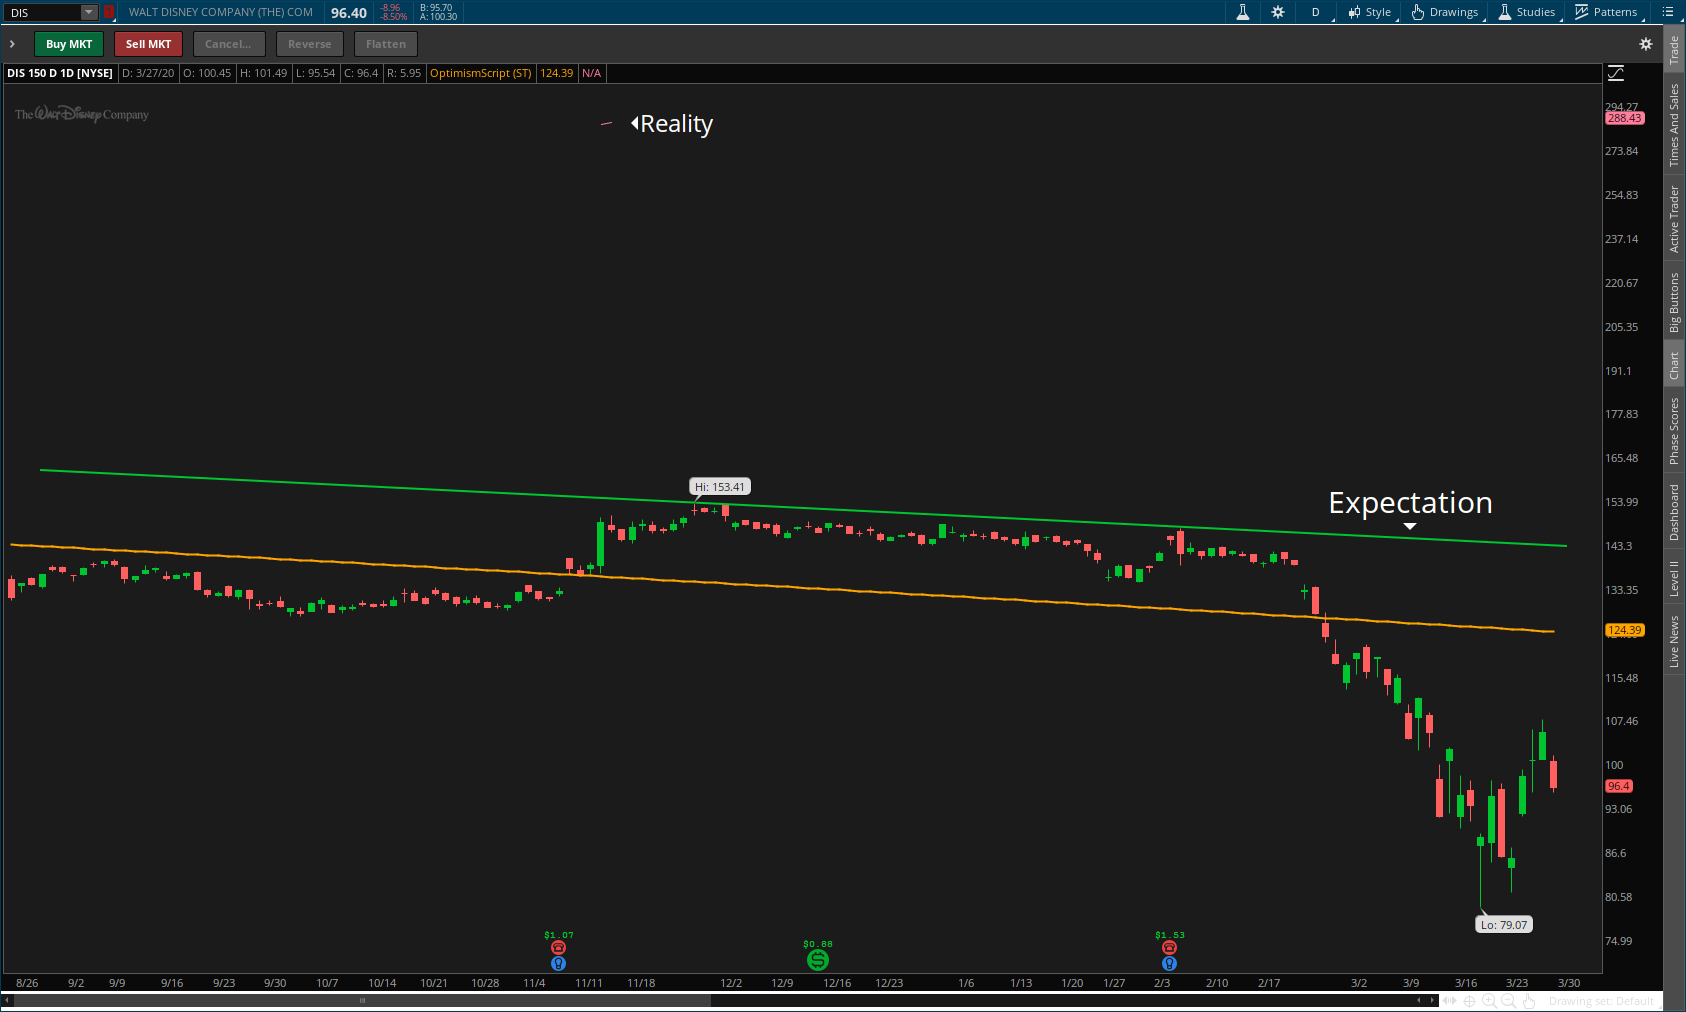
Hi, I am trying to plot a straight line parallel to the LinearRegChVar (orange line) where it will touch the highest price of a specific period.
I’m not quite sure why its not plotting a straight line. Any help would be appreciated!

Below is my script and i have attached some screenshots of my chart. Thanks all.

def today =GetYYYYMMDD ();
def period = DaysTillDate (today);
def LT = 5100;
def MT = 1000;
def ST = 150;
input TimePeriod = {default LT, MT, ST};
plot optimism50;
optimism50.SetDefaultColor (Color.LIGHT_ORANGE);
optimism50.SetLineWeight (2);
switch (TimePeriod) {
case LT:
optimism50 = if period <= LT then linearRegChVar(close,100,no,LT) else double.NaN;

case MT:
optimism50 = if period <= MT then linearRegChVar(close,100,no,MT) else double.NaN;

case ST:
optimism50 = if period hiprice[1] then linearRegChVar(close,100,no,ST) + hiprice else double.NaN;

Attachments:
Marked as spam
Posted by (Questions: 1, Answers: 0)
Asked on March 28, 2020 11:25 pm
90 views
0
Private answer

You will probably find some tips on how to solve this in the following post:

https://www.hahn-tech.com/ans/v2-0-linear-regression-current-price-line-parallel-to-middlelr/


Marked as spam
Posted by (Questions: 37, Answers: 4087)
Answered on March 29, 2020 9:37 am