V2.0 Linear Regression – Current Price line parallel to MiddleLR


Category:
0
0

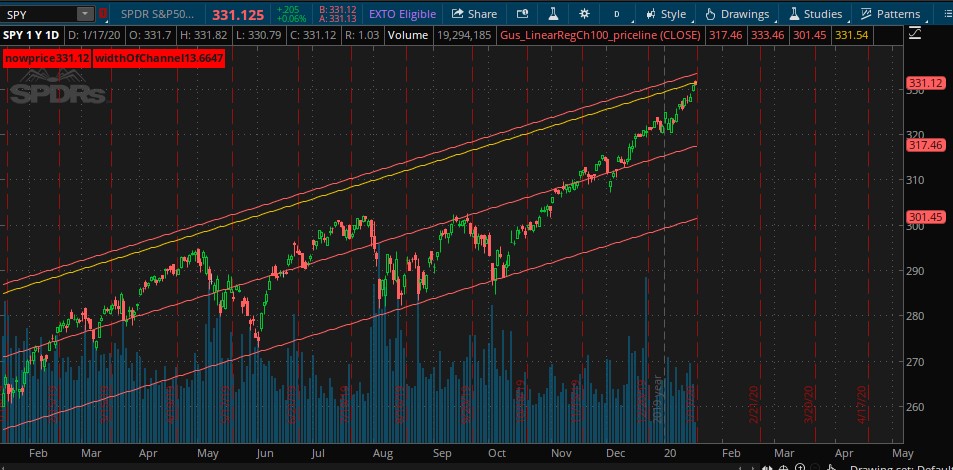
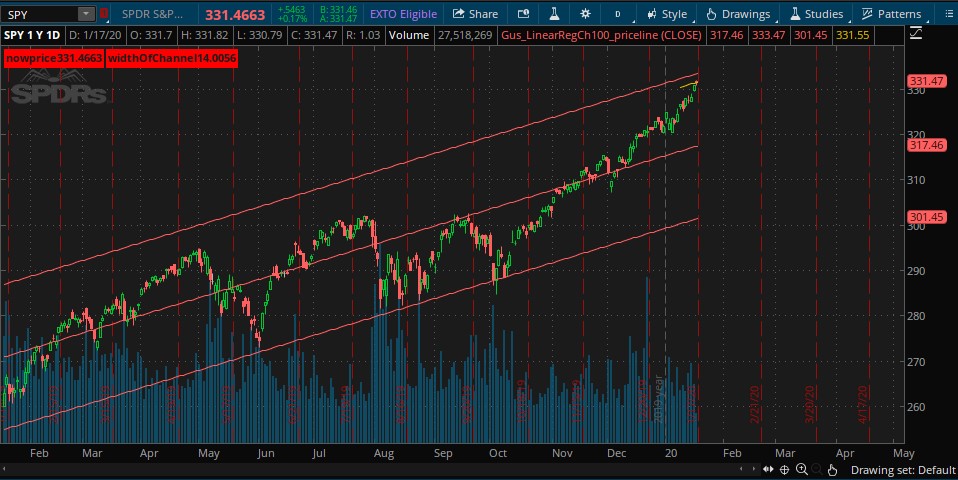
Opinions aside on value derived from LinReg studies.. (this is small piece of a larger puzzle)

Beginning with LinearRegCh100, we add one line to the bottom.

#==================================
# TD Ameritrade IP Company, Inc. (c) 2008-2019
#

input price = close;

plot MiddleLR = InertiaAll(price);
def dist = HighestAll(AbsValue(MiddleLR – price));
plot UpperLR = MiddleLR + dist;
plot LowerLR = MiddleLR – dist;

MiddleLR.setDefaultColor(GetColor(5));
UpperLR.setDefaultColor(GetColor(5));
LowerLR.setDefaultColor(GetColor(5));

plot pricelineCurrentManual = (dist * .88) + MiddleLR;

#========================

When we apply the study to SPY 1 Year/Daily chart. We get a line parallel to the MiddleLR at 88% away from MiddleLR. See image 1. This is EXACTLY what I want my final result to look like. (Today 1/17/20, 88% of dist is approximately where the priceline would be)

I’m looking for a way to pass ONLY the current price variable (percentage away from MiddleLR) into “plot pricelineCurrentManual = (dist * .88) + MiddleLR;” and have it plot the line based on that value only (not evaluated for every bar)

Attempting   if/then/else fails. Result is about what I expected, I’m headed down a wrong path.

#====================================

input price = close;

plot MiddleLR = InertiaAll(price);
def dist = HighestAll(AbsValue(MiddleLR – price));
plot UpperLR = MiddleLR + dist;
plot LowerLR = MiddleLR – dist;

MiddleLR.SetDefaultColor(GetColor(5));
UpperLR.SetDefaultColor(GetColor(5));
LowerLR.SetDefaultColor(GetColor(5));

#plot pricelineCurrentManual = (dist * .88) + MiddleLR;

def lastClose = HighestAll(if IsNaN(close[-1]) then close else Double.NaN);

def percentageCurrent = Round((lastClose – MiddleLR) / dist, 3);

def offsetCurrent25;
if percentageCurrent between 0.00 and 0.26 {
offsetCurrent25 = yes;
} else {
offsetCurrent25 = no;
}
plot plcurrent25;
if !offsetCurrent25 {
plcurrent25 = Double.NaN;
} else {
plcurrent25 = (dist * .25) + MiddleLR;
}
def offsetCurrent50;
if percentageCurrent between 0.25 and 0.51 {
offsetCurrent50 = yes;
} else {
offsetCurrent50 = no;
}
plot plcurrent50;
if !offsetCurrent50 {
plcurrent50 = Double.NaN;
} else {
plcurrent50 = (dist * .50) + MiddleLR;
}
def offsetCurrent75;
if percentageCurrent between 0.50 and 0.76 {
offsetCurrent75 = yes;
} else {
offsetCurrent75 = no;
}
plot plcurrent75;
if !offsetCurrent75 {
plcurrent75 = Double.NaN;
} else {
plcurrent75 = (dist * .75) + MiddleLR;
}
def offsetCurrent90;
if percentageCurrent between 0.75 and 0.95 {
offsetCurrent90 = yes;
} else {
offsetCurrent90 = no;
}

plot plcurrent90;
if !offsetCurrent90 {
plcurrent90 = Double.NaN;
} else {
plcurrent90 = (dist * .95) + MiddleLR;
}
plcurrent25.SetDefaultColor(color.Yellow);
plcurrent50.SetDefaultColor(color.light_GREEN);
plcurrent75.SetDefaultColor(color.DARK_GREEN);
plcurrent90.SetDefaultColor(color.LIGHT_RED);

#=========================================

I wind up with a shortened plot. See image 2.

Which seems to be evaluating ranges of  bars, then falling out of my loop, rather than using the current day’s value.

As I slept on this last night I recalled a LinReg extendToLeft variable, on doing some reading on it, I ran across this, and it may be my answer??

https://www.hahn-tech.com/ans/how-to-extend-point-of-control-into-the-rest-of-the-chart/

Ok, I have already provided the answer to this follow up question but here it is again. The lines on the study are plots. Not trend lines. Plots cannot be extended the way a hand drawn trend line can be. It is not possible. Not under any circumstances or through any method.

My next thought was trying “fold” but thought I would ask for feedback/direction first.

Attachments:
RESOLVED
Marked as spam
Posted by (Questions: 2, Answers: 1)
Asked on January 17, 2020 11:59 am
167 views
0
Private answer

I might be able to assist here:

I’m looking for a way to pass ONLY the current price variable

Using the following line of code you can plot a horizontal line across the entire chart that equals the close price of the last bar on the chart:

plot data1 = HighestAll(if !IsNaN(close) and IsNaN(close[-1]) then close else 0);

From that you should be able to figure out how to compute the price difference between the final bar on the chart and the value of the middle trend line at the last bar of the chart. Here is a line of code to return the value of the middle trend line at the last bar on the chart:

plot data2 = HighestAll(if !IsNaN(close) and IsNaN(close[-1]) then MiddleLR else 0);

The last step would be to compute the difference between them and apply that mathematical result to the rest of the bars on the chart such that it draws a parallel plot a constant distance from the middle line across the entire chart.

If you are trying to extend those trend line plots into the empty expansion area at the right-hand side of the chart. Well that may be possible. I can do so with a horizontal line but have not tried doing it will a trending plot line. However I cannot afford to spend that sort of time on a free solution in the Q&A forum. I have already exceeded my time limit responding to this and the previous post.

Marked as spam
Posted by (Questions: 37, Answers: 4087)
Answered on January 17, 2020 12:25 pm
0
I knew I was getting wrapped around the axle. Your insight is as keen as ever. Thank you! I'm unable to enter anything in the solution area so putting it here. Following is solution (with lines extended to right) input price = close; plot MiddleLR = InertiaAll(price,extendtoright = 1); def dist = HighestAll(AbsValue(MiddleLR - price)); plot UpperLR = MiddleLR + dist; plot LowerLR = MiddleLR - dist; MiddleLR.SetDefaultColor(GetColor(5)); UpperLR.SetDefaultColor(GetColor(5)); LowerLR.SetDefaultColor(GetColor(5)); def data1 = HighestAll(if !IsNaN(close) and IsNaN(close[-1]) then close else 0); def data2 = HighestAll(if !IsNaN(close) and IsNaN(close[-1]) then MiddleLR else 0); def dataDiff = data1-data2; plot data3 = MiddleLR+dataDiff;
( at January 17, 2020 5:54 pm)
0
Private answer

Solution (with some color)

input price = close;

plot MiddleLR = InertiaAll(price, extendtoright = 1);

def dist = HighestAll(AbsValue(MiddleLR - price));

plot UpperLR = MiddleLR + dist;

plot LowerLR = MiddleLR - dist;


MiddleLR.SetDefaultColor(CreateColor(255, 253, 209));

UpperLR.SetDefaultColor(CreateColor(230, 0, 0));

LowerLR.SetDefaultColor(CreateColor(0, 230, 0));


def lastPrice = HighestAll(if !IsNaN(close) and IsNaN(close[-1]) then close else 0);

def lastMiddleLR = HighestAll(if !IsNaN(close) and IsNaN(close[-1]) then MiddleLR else 0);

#def LastDifference = LastPrice - LastMiddleLR;

def currentDiverge = lastPrice - lastMiddleLR;

plot LRDivergence = MiddleLR + currentDiverge;


def currentDivergePercentage = currentDiverge / (dist/100);


LRDivergence.SetPaintingStrategy(PaintingStrategy.LINE);

LRDivergence.DefineColor("Up4LR", CreateColor(230, 0, 0));

LRDivergence.DefineColor("Up3LR", CreateColor(255, 102, 102));

LRDivergence.DefineColor("Up2LR", CreateColor(255, 153, 153));

LRDivergence.DefineColor("Up1LR", CreateColor(255, 204, 204));

LRDivergence.DefineColor("Dn1LR", CreateColor(204, 255, 204));

LRDivergence.DefineColor("Dn2LR", CreateColor(153, 255, 153));

LRDivergence.DefineColor("Dn3LR", CreateColor(102, 255, 102));

LRDivergence.DefineColor("Dn4LR", CreateColor(0, 230, 0));

LRDivergence.DefineColor("error", CreateColor(0, 1, 0));


LRDivergence.AssignValueColor( 

if currentDivergePercentage between 0 and 26 then LRDivergence.Color("Up1LR") else 

if currentDivergePercentage between 25 and 51 then LRDivergence.Color("Up2LR") else  

if currentDivergePercentage between 50 and 76 then LRDivergence.Color("Up3LR") else 

if currentDivergePercentage between 75 and 110 then LRDivergence.Color("Up4LR") else

if currentDivergePercentage between -26 and 0 then LRDivergence.Color("Dn1LR") else 

if currentDivergePercentage between -51 and -25 then LRDivergence.Color("Dn2LR") else  

if currentDivergePercentage between -76 and -50 then LRDivergence.Color("Dn3LR") else  

if currentDivergePercentage between -110 and -75 then LRDivergence.Color("Dn4LR") else  

LRDivergence.Color("error")

);

Marked as spam
Posted by (Questions: 2, Answers: 1)
Answered on January 18, 2020 7:53 am