How to draw line segments in Thinkscript between any two points on the chart?


Category:
0
0

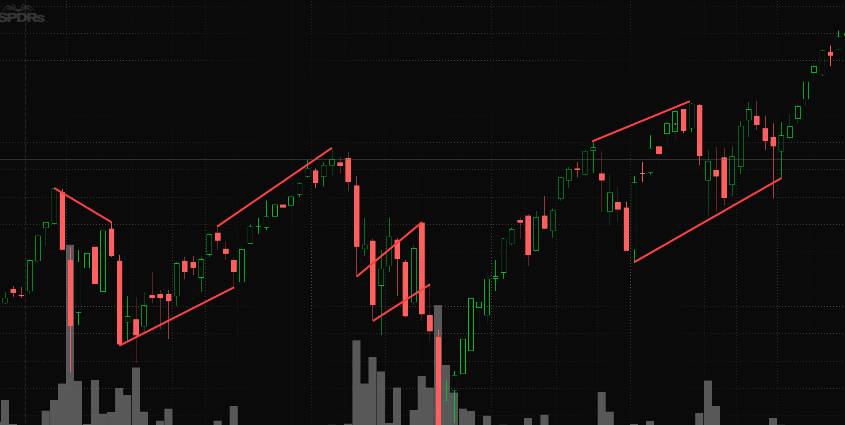
I would like to draw arbitrary number of line segments on the chart using Thinkscript, but did not find any documentation or function to achieve that. For example, I would like to plot lines between pivot points as shown on the attached chart.

Attachments:
Marked as spam
Posted by (Questions: 2, Answers: 0)
Asked on December 15, 2019 4:36 pm
1085 views
0
Private answer

Thinkorswim language does not permit us to create or modify drawing objects on the chart. This explains why you found no such documentation. Even if this were possible, the code required to do this would be far more advanced than anything we would provide for no charge in the Q&A forum.

Marked as spam
Posted by (Questions: 37, Answers: 4087)
Answered on December 15, 2019 5:12 pm