Great job on the new post. This is very clear and helpful for other viewers.
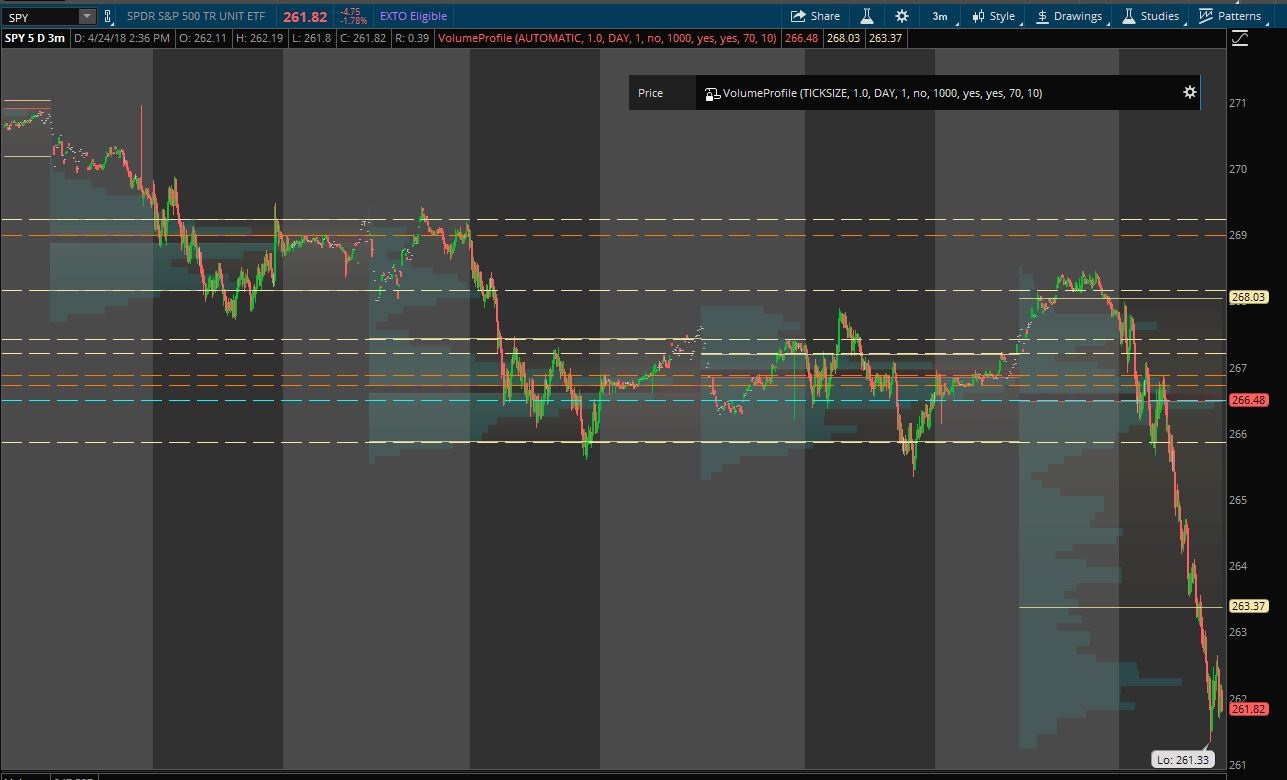
So what I see in your screenshot are horizontal lines from several of the volume profiles. Not just one, as I had envisioned from your first post. It seems what you want is for every single profile on the chart to extend horizontal lines both left and right. Not just a single profile. Is this correct?
If so, it is not possible. Why? The VAH, VAL and POC lines on the chart of Volume Profile are plots, not trend lines. So when you see various profiles on the chart, each with it’s own POC. That POC is a single plot on the chart. One plot, that changes value for each profile period. Notice the POC line from each profile does not overlap with any other. This is because for each candle on a chart, a plot can only have one value.
In order to achieve anything close to what you have pictured would require one of two things.
- Thinkscript would need to be modified to give developers access to drawing tools. We would need to write code that placed a trend line at each level of each profile period.
- You would need to add several new plots to the study.
I’ll expand on option 2. Let’s say your chart has 4 profiles. Each profile has 3 levels you want to extend. You would need to add 12 new plots to the study. Each of the plots would need to employ logic that instructed it which profile (and which level within each profile) it belonged to. Then another trick would need to be added that caused each plot to display at a constant level for the entire chart.
What happens if you change the chart settings and now have 5 profiles you want tracked? You add another 3 plots. And so on, and so on…. It’s a programmer’s nightmare.
Be sure to leave more details in the comment section below if you feel I left out anything or have more details to provide.
I see the author of the post has tried to post a response. However instead of using the comment section (such as this entry right here) they used the “Post you Answer” box at the bottom of the thread. The “Post you Answer” box is meant for new solutions to the posted questions. So that entry is being deleted.
The contents of the response is posted here:
“Pete, yes you are right I want the extension on every profile. All these lines are already there just need to be extended on both sides, something like a trend line I draw can open on both sides from the setting. Does the study have a similar function? Do you think it is possible if you change the date setting at the front of the code to achieve this? because when I deleted all periods and time setting in the code, I did get a POC line through the whole chart. But only for the last day. Also I saw you extend the value profile window from the previous day to today in your Volumeprofile V2 video. Is it the same thing as what I ask for? Thanks.”
Ok, I have already provided the answer to this follow up question but here it is again. The lines on the study are plots. Not trend lines. Plots cannot be extended the way a hand drawn trend line can be. It is not possible. Not under any circumstances or through any method.
As to the behavior of our premium study “Volume Profile”. That study does not “extend” the values into the next profile period. It displaces them, forward, into the next profile period. Everything is shifted one period into the future. There is a significant difference between that and what you are requesting.
Pete, thanks for your inputs, I saw you mention the drawing tool above. Just wonder if there is an advanced drawing tool that can do this. I understood it is difficult but if you are still interested in helping me I am willing to pay for your work as long as I can afford it:-). Thanks.
It is not ‘difficult’. It is ‘not possible’. Can’t do it. Won’t happen. Can’t be done. Can’t get there from here. There is an unbridgeable gap between the technical abilities of Thinkorswim and your goals. Unbridgeable gap. Money is not the issue. Technology is the issue. The technology to do this is not available in the Thinkorswim platform. I could go on but having stated all this in my previous responses I hope I have finally cleared this up. I am sorry.