| ♥ 0 |
I am learning how to script on the TOS platform. I like a grid chart on a primary aggregation and I would like to have an RSI label on a 1 hour chart with the RSI Daily aggregation value. This would allow me to monitor the daily time and learn more skills about secondary aggregations. I am new to this site and I am glad to be here. Thanks Kevin
RESOLVED
Marked as spam
|
|
Private answer
You did it! I studied what you did, I learned secondary aggregation, That is huge to me. Big thanks and I found a good forum “Community” to be a part of. Thanks so much Kevin
Marked as spam
Answered on January 8, 2017 9:14 am
|
|||
|
Private answer
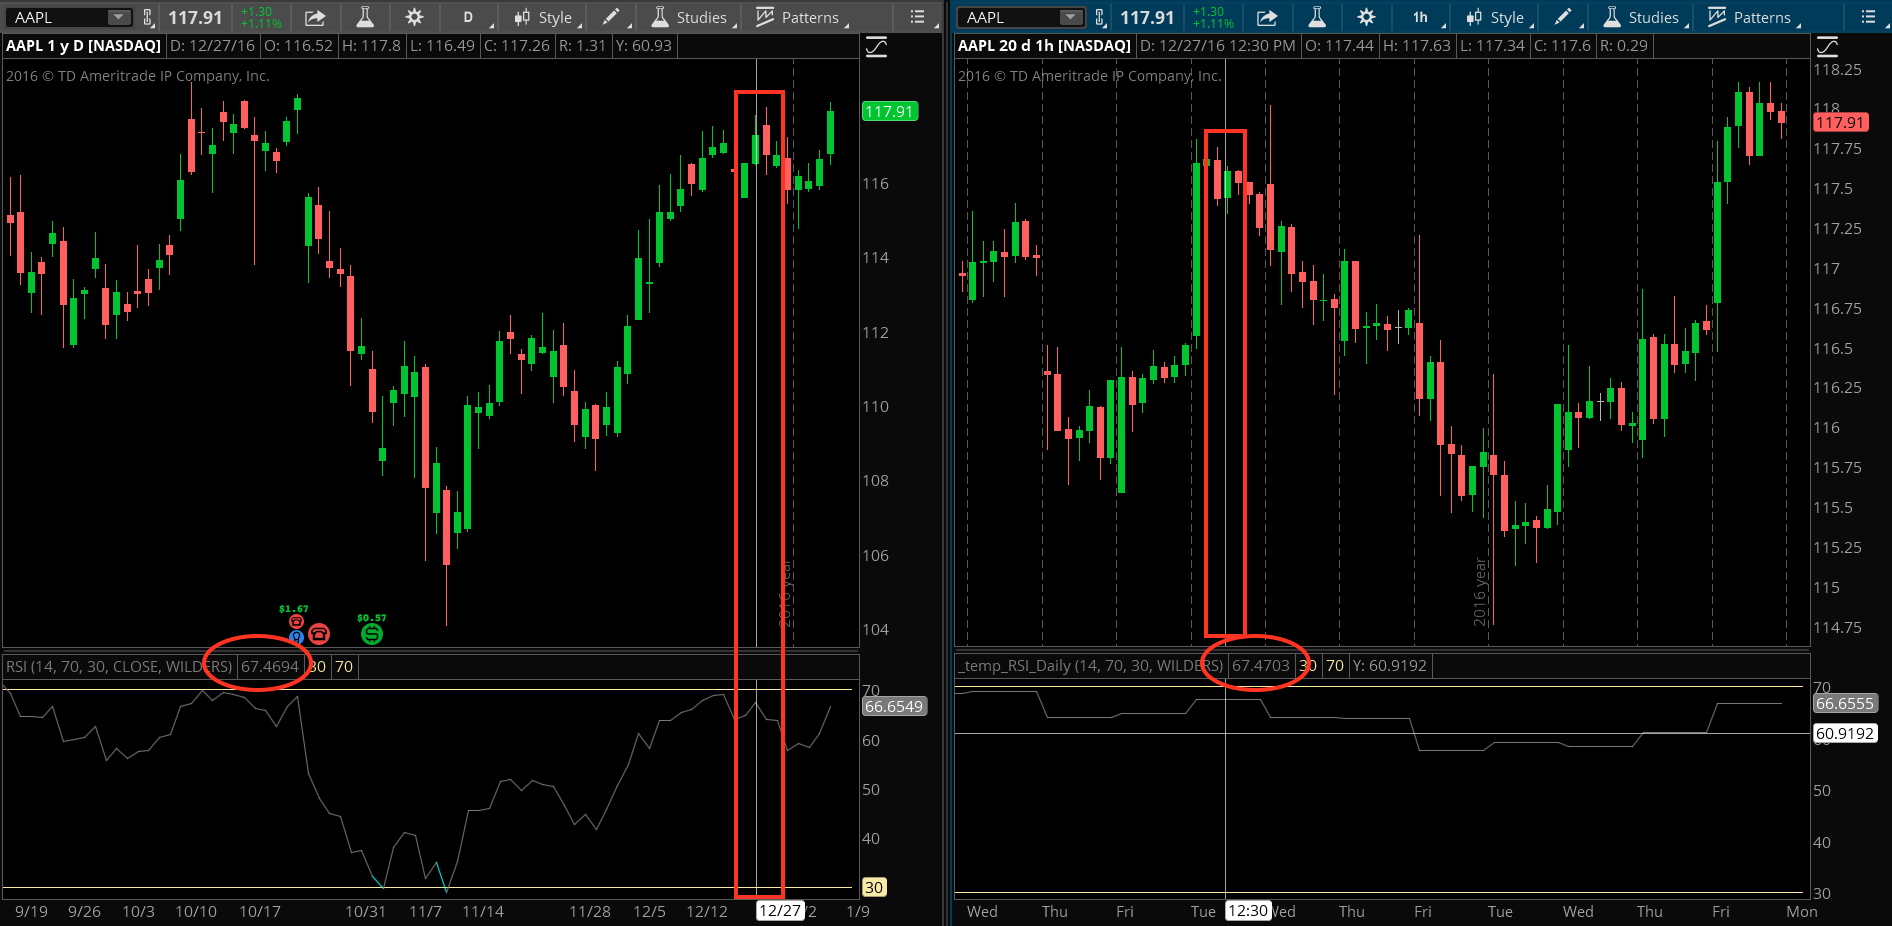
The built in RSI study provided by Thinkorswim is our starting point. I have modified the code to reference the daily time frame. Screenshot attached. You see the Daily on the left and the Hourly on the right. The cross-hairs on the charts point to the same day. You can see the value on the RSI Daily is a nearly exact match for the RSI plotted on the Hourly chart. Be sure to up-vote this answer if it correctly answered your question! Thanks. Here is the code: Attachments:
Marked as spam
Answered on January 6, 2017 7:45 pm
|
Kevin,
I am pretty new to tos, which code did you apply and where did you apply it to (I see the declare lower from pete and your declare upper, kind of confused on where to apply this to)? I know how to add studies, however when i do add pete’s code from above I am not seeing the RSI value shown circled red in that screenshot from above. My apologies in advance if these are dumb questions, just trying to learn and make my money back from my early mistakes in trading.
TIA
Alex
I’ll let Kevin respond regarding his own code. But I understand your confusion and wanted to let you know that the code I provided is a completely different study than the code that Kevin plotted. In regards to your question about the screenshots I provided. The RSI value circled in red. That screenshot shows the RSI value on the hourly chart to the right matches the RSI value on the daily chart to the left. Those values are circled to ensure the matching values are clearly seen. Simply put, the code I published plots the daily value of the RSI on a intraday timeframe chart.
Hi try this study in TOS but I am getting error in these line. please fix it and post it again. Thanks
# Define a variable for RTH Alert Active
def periodStart = if secondsTillTime(periodStartEST) 0 then 1 else 0;
def periodEnd = if secondsTillTime(periodEndEST) 0 then 1 else 0;