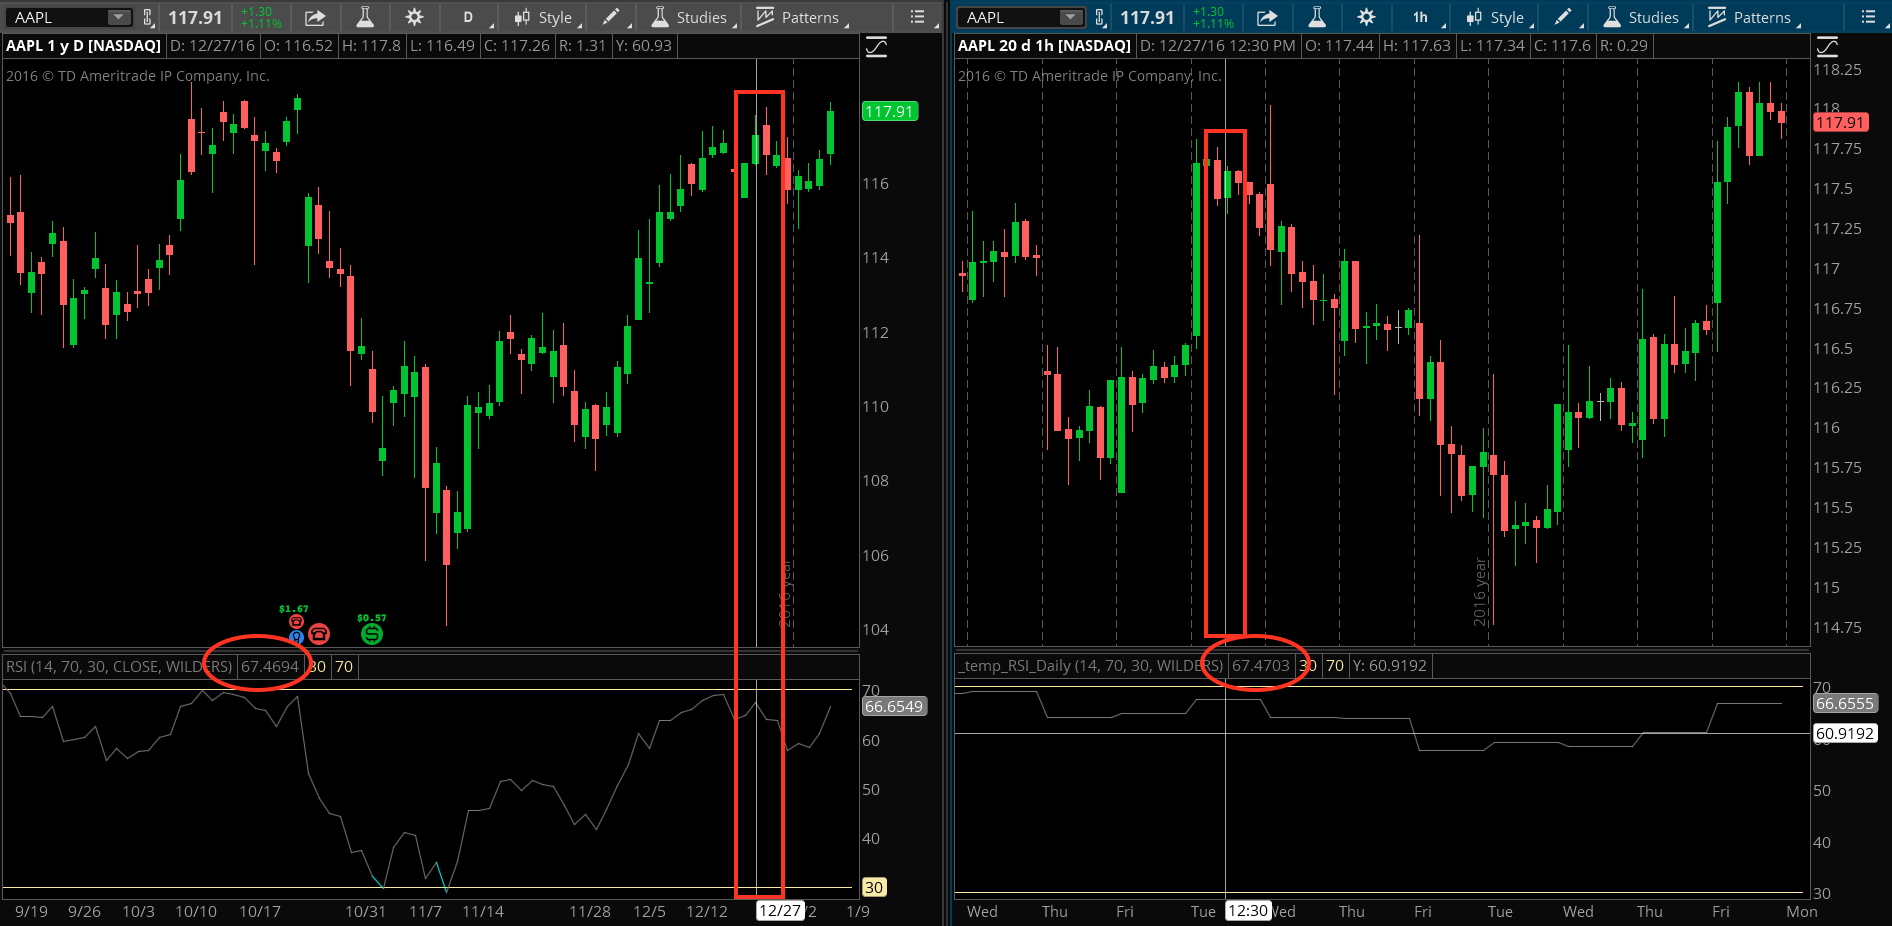
The built in RSI study provided by Thinkorswim is our starting point. I have modified the code to reference the daily time frame. Screenshot attached. You see the Daily on the left and the Hourly on the right. The cross-hairs on the charts point to the same day. You can see the value on the RSI Daily is a nearly exact match for the RSI plotted on the Hourly chart.
Be sure to up-vote this answer if it correctly answered your question! Thanks.
Here is the code:
#

# TD Ameritrade IP Company, Inc. (c) 2007-2016

#

declare lower;

input length = 14;

input over_Bought = 70;

input over_Sold = 30;

input averageType = AverageType.WILDERS;

def NetChgAvg = MovingAverage(averageType, close(period = AggregationPeriod.DAY) - close(period = AggregationPeriod.DAY)[1], length);

def TotChgAvg = MovingAverage(averageType, AbsValue(close(period = AggregationPeriod.DAY) - close(period = AggregationPeriod.DAY)[1]), length);

def ChgRatio = if TotChgAvg != 0 then NetChgAvg / TotChgAvg else 0;

plot RSI = 50 * (ChgRatio + 1);

plot OverSold = over_Sold;

plot OverBought = over_Bought;

RSI.DefineColor("OverBought", GetColor(5));

RSI.DefineColor("Normal", GetColor(7));

RSI.DefineColor("OverSold", GetColor(1));

RSI.AssignValueColor(if RSI > over_Bought then RSI.color("OverBought") else if RSI < over_Sold then RSI.color("OverSold") else RSI.color("Normal"));

OverSold.SetDefaultColor(GetColor(8));

OverBought.SetDefaultColor(GetColor(8));
Thanks to the help I got it was possible to script a label that you can put on a flexible grid to monitor
all your trade vehicles with the RSI Alert, bubble, arrow and background option. This trade philosophy was
taken by author Dr Alexander Elder to trade with the tide, take advantage of the waves and ignore the ripples.
If any has suggestions that fit this Philosophy I would love to hear about.
Kevin
declare upper;
input showlabel = yes;
input showalert = no;
input changeBackground = no;
input showBubble = yes;
input BubbleOffset = 12 ;
input length = 14;
input zero = 50;
input SOS = 30;
input SOB = 70;
input price = close;
input averageType = AverageType.WILDERS;
input Agg = AggregationPeriod.day;
input periodStartEST = 930;
input periodEndEST = 1600;
DefineGlobalColor(”sob”, Color.DARK_GREEN);
DefineGlobalColor(”SOS”, Color.RED);
DefineGlobalColor(”Rsi”, Color.BLACK);
DefineGlobalColor(”zero”, Color.cyan);
DefineGlobalColor(”bubble”, Color.cyan);
DefineGlobalColor(”alert”, Color.PINK);
DefineGlobalColor(”SIG”, Color.DARK_GRAY);
DefineGlobalColor(”alert”, Color.PINK);
# Define a variable for RTH Alert Active
def periodStart = if secondsTillTime(periodStartEST) 0 then 1 else 0;
def periodEnd = if secondsTillTime(periodEndEST) 0 then 1 else 0;
def inPeriod = if periodStart then 1 else if periodEnd then 0 else inPeriod[1];
def NetChgAvg = MovingAverage(averageType, close(period = Agg) – close(period = Agg)[1], length);
def TotChgAvg = MovingAverage(averageType, AbsValue(close(period = Agg) – close(period = Agg)[1]), length);
def ChgRatio = if TotChgAvg != 0 then NetChgAvg / TotChgAvg else 0;
def myRSI = 50 * (ChgRatio + 1);
def RsiIncrease = myRSI > myRSI[1];
def RsiDecrease = myRSi < myRSI[1]; def RsiIncreaseBars = if RsiIncrease then RsiIncreaseBars[1] + 1 else 0; def RsiDecreaseBars = if RsiDecrease then RsiIncreaseBars[1] + 1 else 0; Def BarSignal = rsiIncreaseBars + RsiDecreaseBars; AddLabel(showlabel, " RSI(D) = (" + round(myRSI,1) + ") " + " (" + Barsignal + ") ", if myRsi > 52
then GlobalColor(”sob”) else if myrsi < 48 then GlobalColor("sos")else GlobalColor("bubble")); Def AlertSOS = MyRsi < SOS; Def AlertSOB = MyRsi > SOB;
alert(showalert and alertSOB and inperiod, ”RSI DAILY OVERBOUGHT ”, alert.bar, sound.ding);
alert(showalert and alertSOS and inperiod, ”RSI DAILY OVERSOLD PANIC”, alert.bar, sound.ding);
assignBackgroundColor( if alertsob or alertsos and inperiod and changeBackground then GlobalColor(”alert”) else color.current);
# Code to paint arrows
plot crossingAbove = Crosses(myRsi, sob, CrossingDirection.ABOVE);
crossingabove.SetPaintingStrategy(PaintingStrategy.BOOLEAN_ARROW_down);
crossingAbove.setlineweight(5);
crossingAbove.setDefaultColor(globalcolor(”SIG”));
plot crossingbelow = Crosses(myRsi, sos, CrossingDirection.below);
crossingbelow.SetPaintingStrategy(PaintingStrategy.BOOLEAN_ARROW_UP);
crossingbelow.setlineweight(5);
crossingbelow.setDefaultColor(globalcolor(”SIG”));
# Add chart bubble for description of arrow
addchartBubble(showBubble and alertSob,
high + BubbleOffset, ” RSID (” + round(myRsi,1) + ”) ”,GlobalColor(”bubble”), yes);
addchartBubble(showBubble and alertSos,
low – BubbleOffset, ” RSID (” + round(myRsi,1) + ”) ”,GlobalColor(”bubble”), no);