| ♥ 0 |
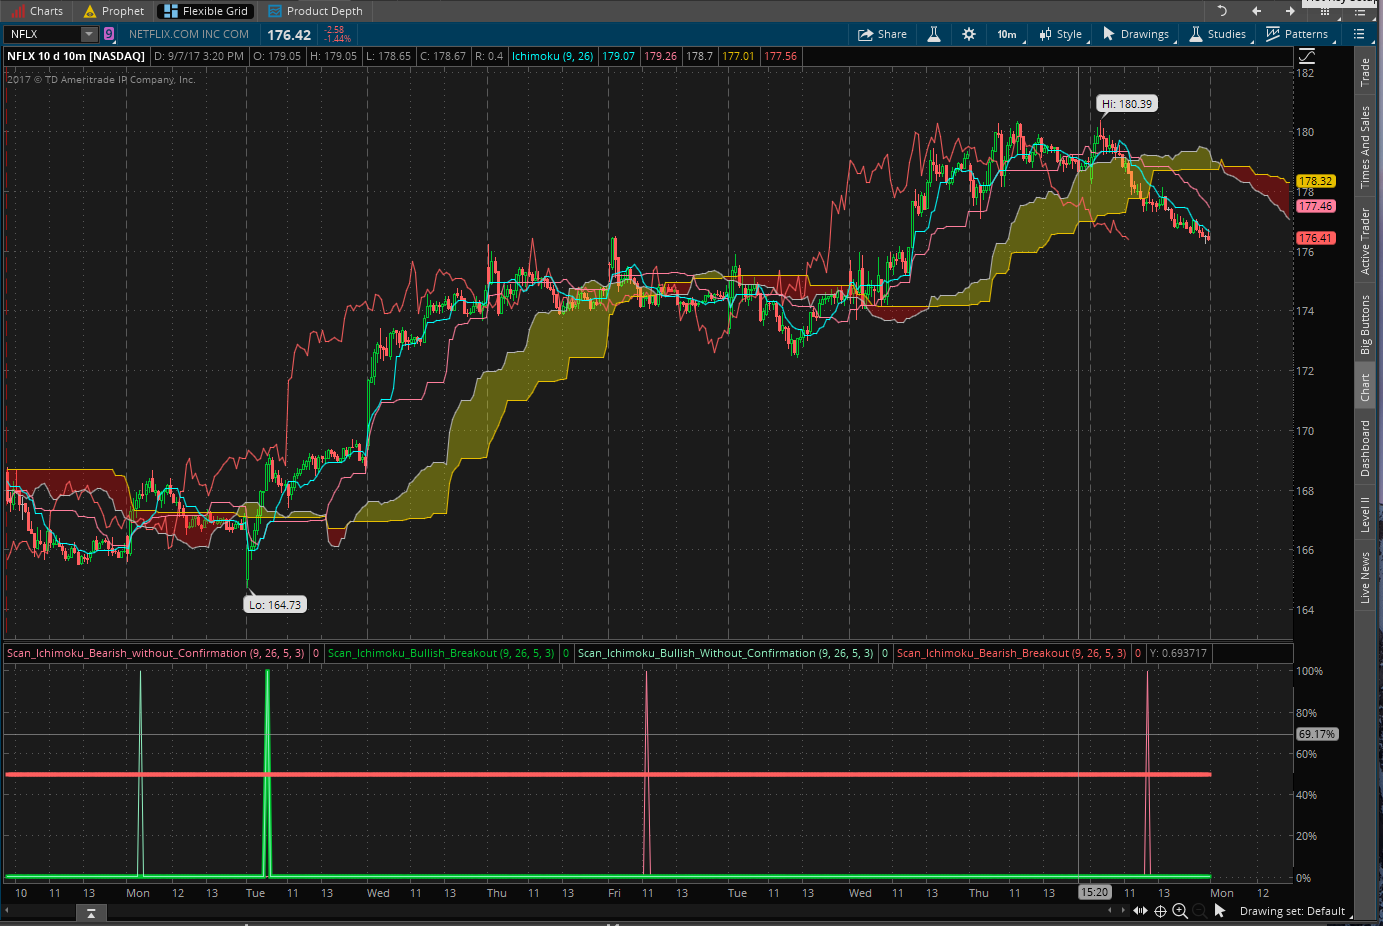
Hi Pete, First, thank you for the awesome scanner and videos. I have literally been tweaking the scanner for the past 5 hours. I noticed something with the Bearish breakout with confirmation scanners. I understand if the Chikou is not below the cloud when 3 periods or price action post below the cloud, you will not get a “bearish breakout with confirmation signal.” However, I noticed you still don’t get a “bearish breakout with confirmation signal” when the chikou signal does finally break below the cloud. I had a chart where the chikou finally passed the cloud on like the 8th period or so, but no breakout with confirmation signal showed up. Is that not considered a “bearish breakout with confirmation?” Same can be said about the “bullish breakout with confirmation indicator.” For now, I’ve also plotted bullish/bearish breakouts w/o confirmation and manually tracking to see if the chikou eventually makes it through the cloud all the way. Thanks much and can’t wait to read your response. I added a 10 min NFLX chart that shows this. The pink signal at the bottom is the bullish breakout without confirmation. I would think my Red signal with confirmation should have shown when the chikou finally broke through? Dale Attachments:
Marked as spam
Asked on September 10, 2017 10:20 pm
299 views
|
Based on your questions, I tend to believe you have not watched the videos I linked to Huber Senters class. I really can’t give you any helpful trading advice. I write code for my income, trading hasn’t worked for me yet. To summarize Hubert’s explanation about time frames. He says each time frame gives you setups that are expected last a specific number of hours/days. I don’t recall the detail. But he explains the length of time each time frame should be to complete the trade. He says to pick the time frame that gives you the span of time you prefer. If I remember correctly, 10 min chart gives you hours in a trade, 1 hour chart gives you days in a trade and daily chart gives you weeks in a trade. Be sure to watch his videos. Very much worth your time.