| ♥ 0 |
Pete or anyone, I am trying to come up with a scan with the conditions: close reached a new 52 week high within the last 10 days I tried using the following taken from one of your previous posts: def fiftyTwoWeekHigh = Highest(high, 252) within 10 bars; Unfortunately that scan did not work. Thanks for any help you can give me.
Marked as spam
Asked on May 4, 2018 7:18 am
3422 views
|
|
Private answer
Best thing would have been to provide a link where you found the code that you started with. Saying it was one of my previous posts does not permit us to easily locate the original. Why is this important? Because if we have the original to compare too, we can see what changes you made in your attempt to solve this riddle. But I found it: https://www.hahn-tech.com/ans/close-to-a-new-high-question/ Step-by-step InstructionsSo let’s get into the details. In your very first line: Adding within 10 bars to the end of the original statement makes the statement of zero value to the rest of the lines of code. Despite what you expected, it does not say “highest high within the last 10 bars”. Whenever you want to know what the code is doing while making changes, just plot it on a chart. Then you can change def to plot on select lines and find out what they look like on a chart. In this case, it plots a 1 or a zero. And you need it to plot the highest high in 52 weeks. So how do we write this? First, we leave the original line of code because it does plot the highest high in 52 weeks: Next we see that you are looking for stocks that are NOT at their 52 week high, but are within a specified range. So the next line code needs to state that the current high is not equal to the 52 week high, but is fewer than 10 days away from that 52 week high.
We have to do that in two lines of code. First one is a true/false statement that is true when the fiftyTwoWeekHigh variable is higher than it’s previous value. (the stock has made a new 52 week high). The second line is also a true/false statement. It is true when the current high less than the fiftyTwoWeekHigh and we have a new 52 week high within the last 10 bars. Good news! Next two lines of code are taken right from your example:
From your specifications we find that you want the current close of the bar to less than the 5% from high value. At the same time you want the current close to be greater than the 10% from high value.
This too is a true/false statement. Evaluating to true when the current bar’s close is between these two values. Now we have to variables that are true/false and we only need to put them together. They both must be true in order for your specifications to be met.
The Final ResultThat’s it. We’re done. Let’s mash then all together to reduce the risk of folks make copy/paste errors:
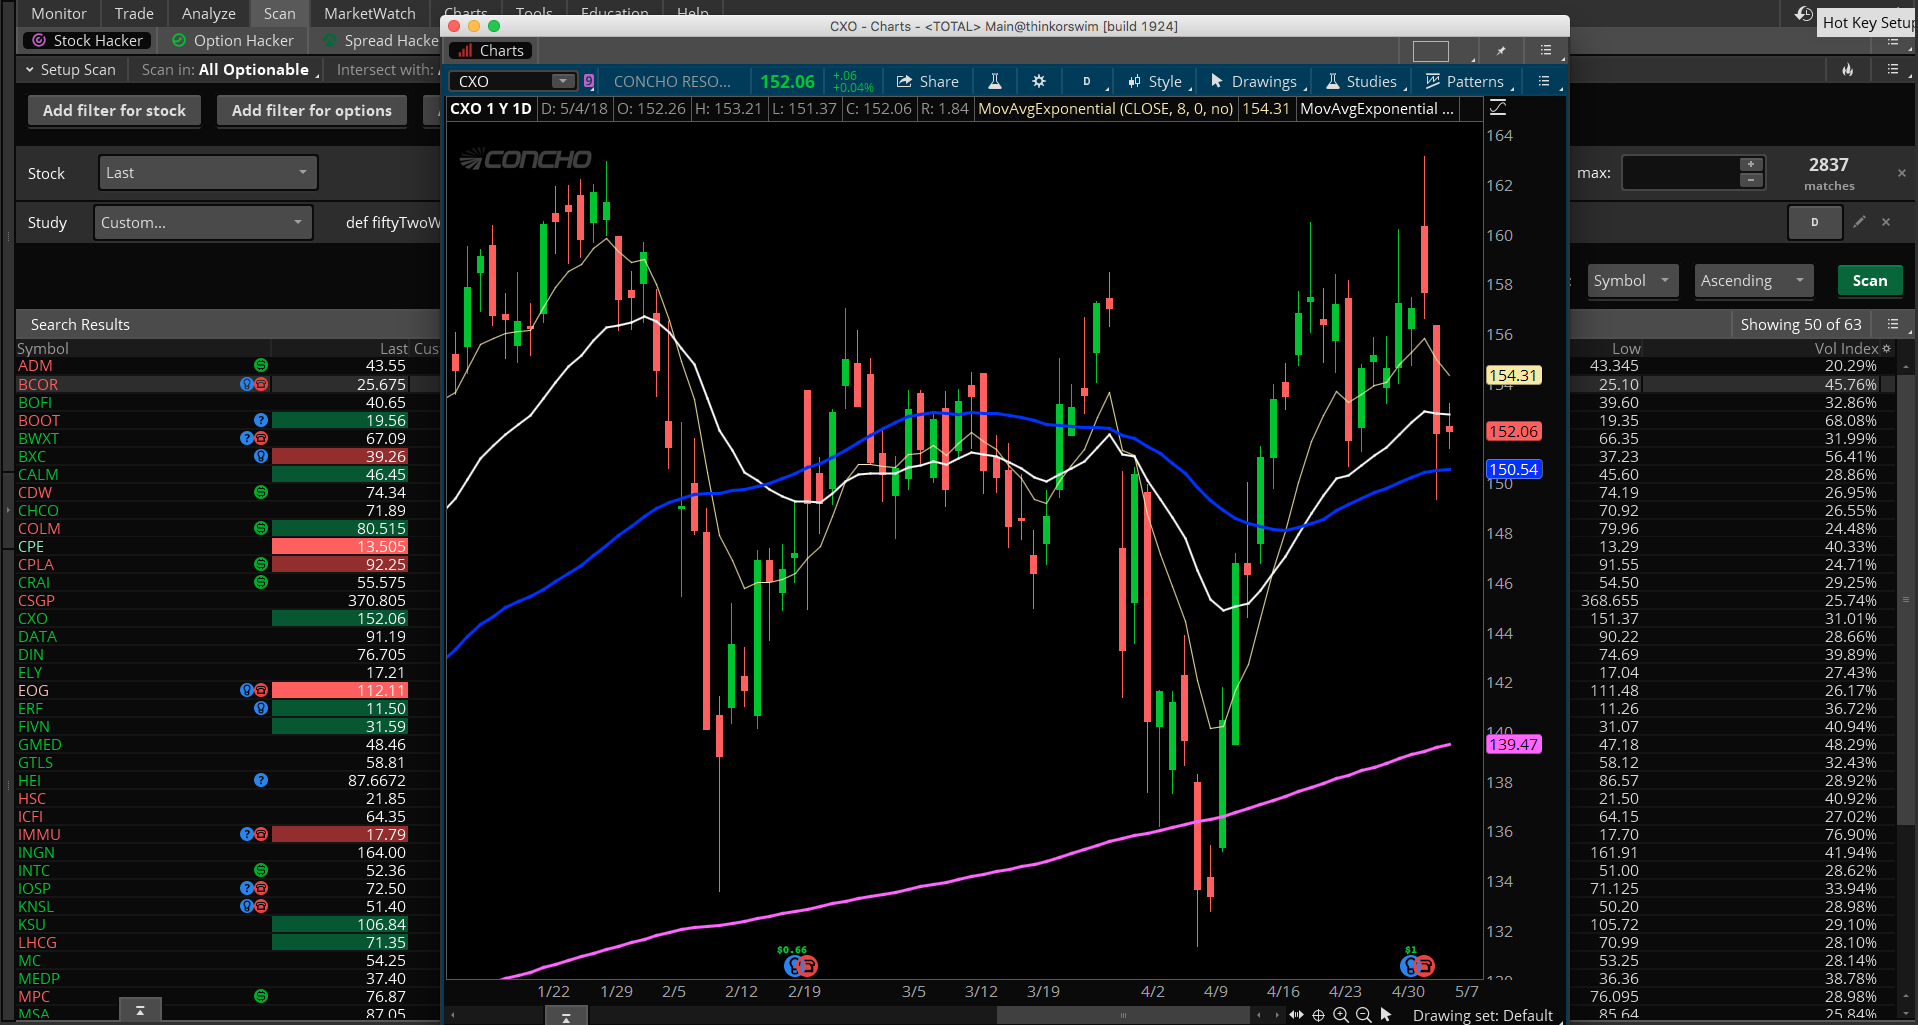
Screenshot below shows the scan results and a chart. In this case ticker symbol CXO is 2 day away from it’s 52 week high and the current bar’s close is around 6% below that 52 week high. I have not thoroughly tested this so be sure to examine the results closely until you know it does the job. Let me know if you find anything amiss. Attachments:
Marked as spam
Answered on May 4, 2018 8:11 am
|