Indicator Showing 52-Week High with Arrow


Category:
0
0

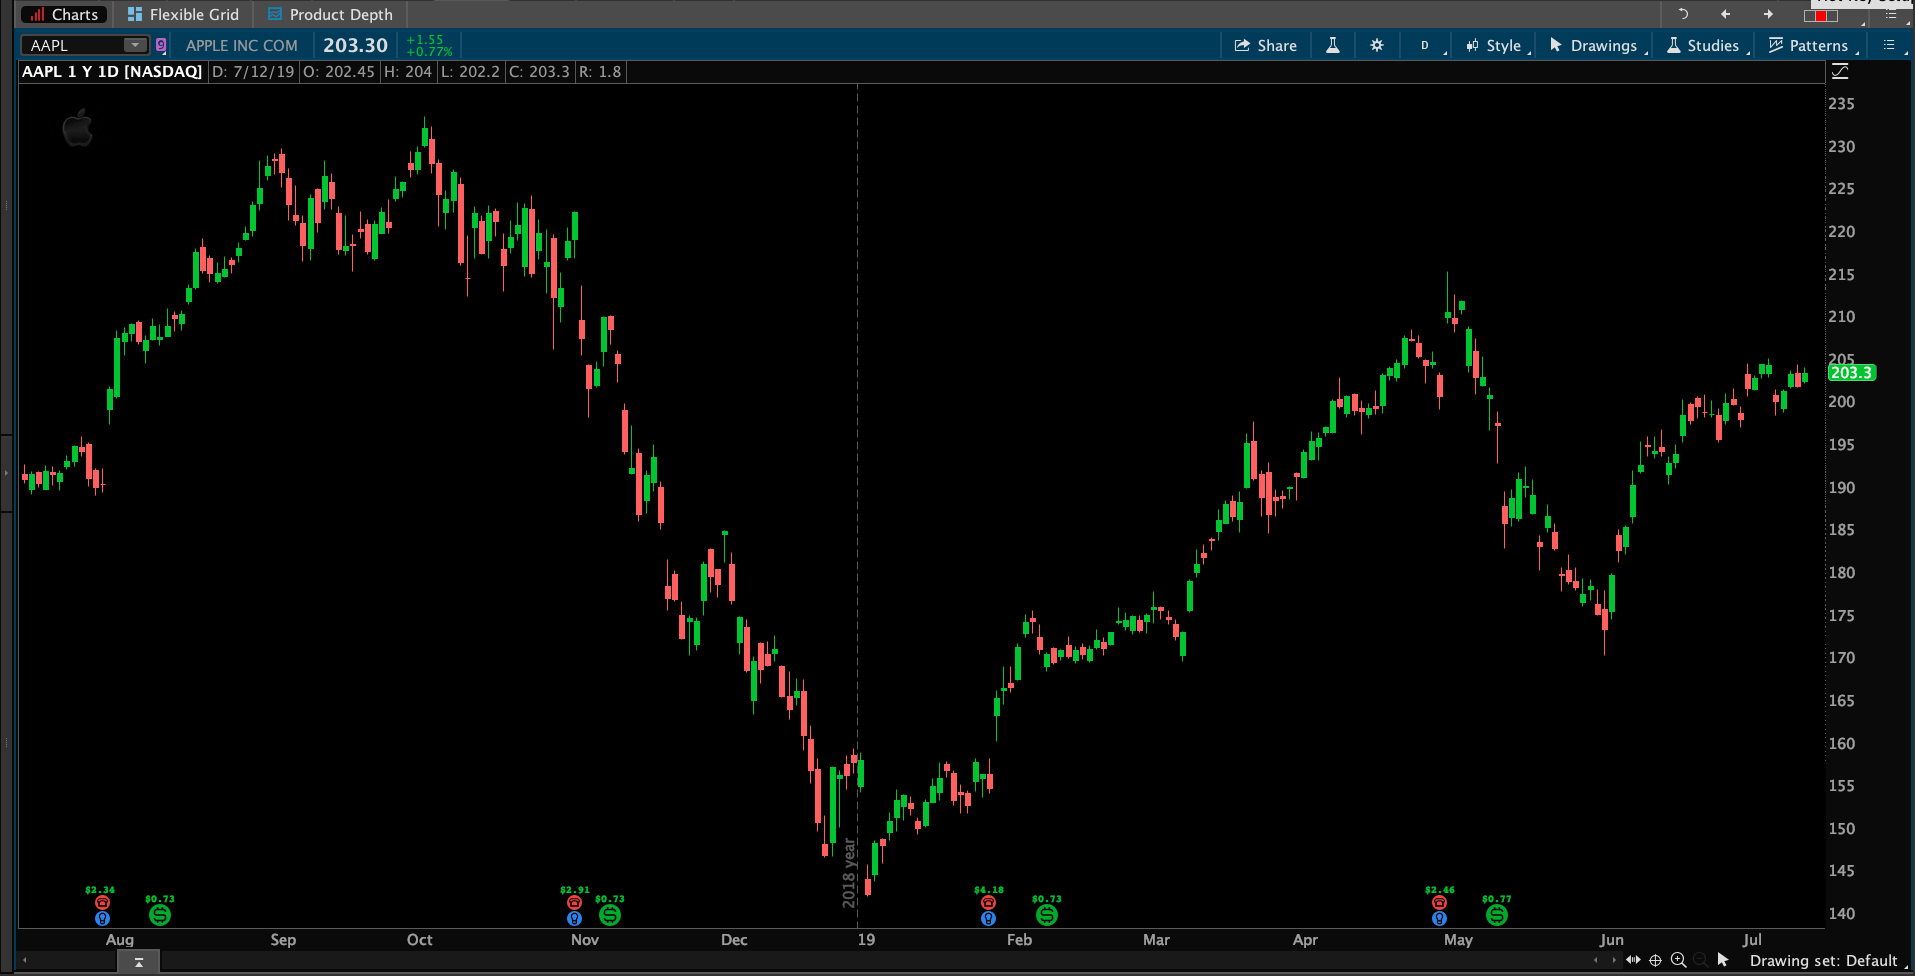
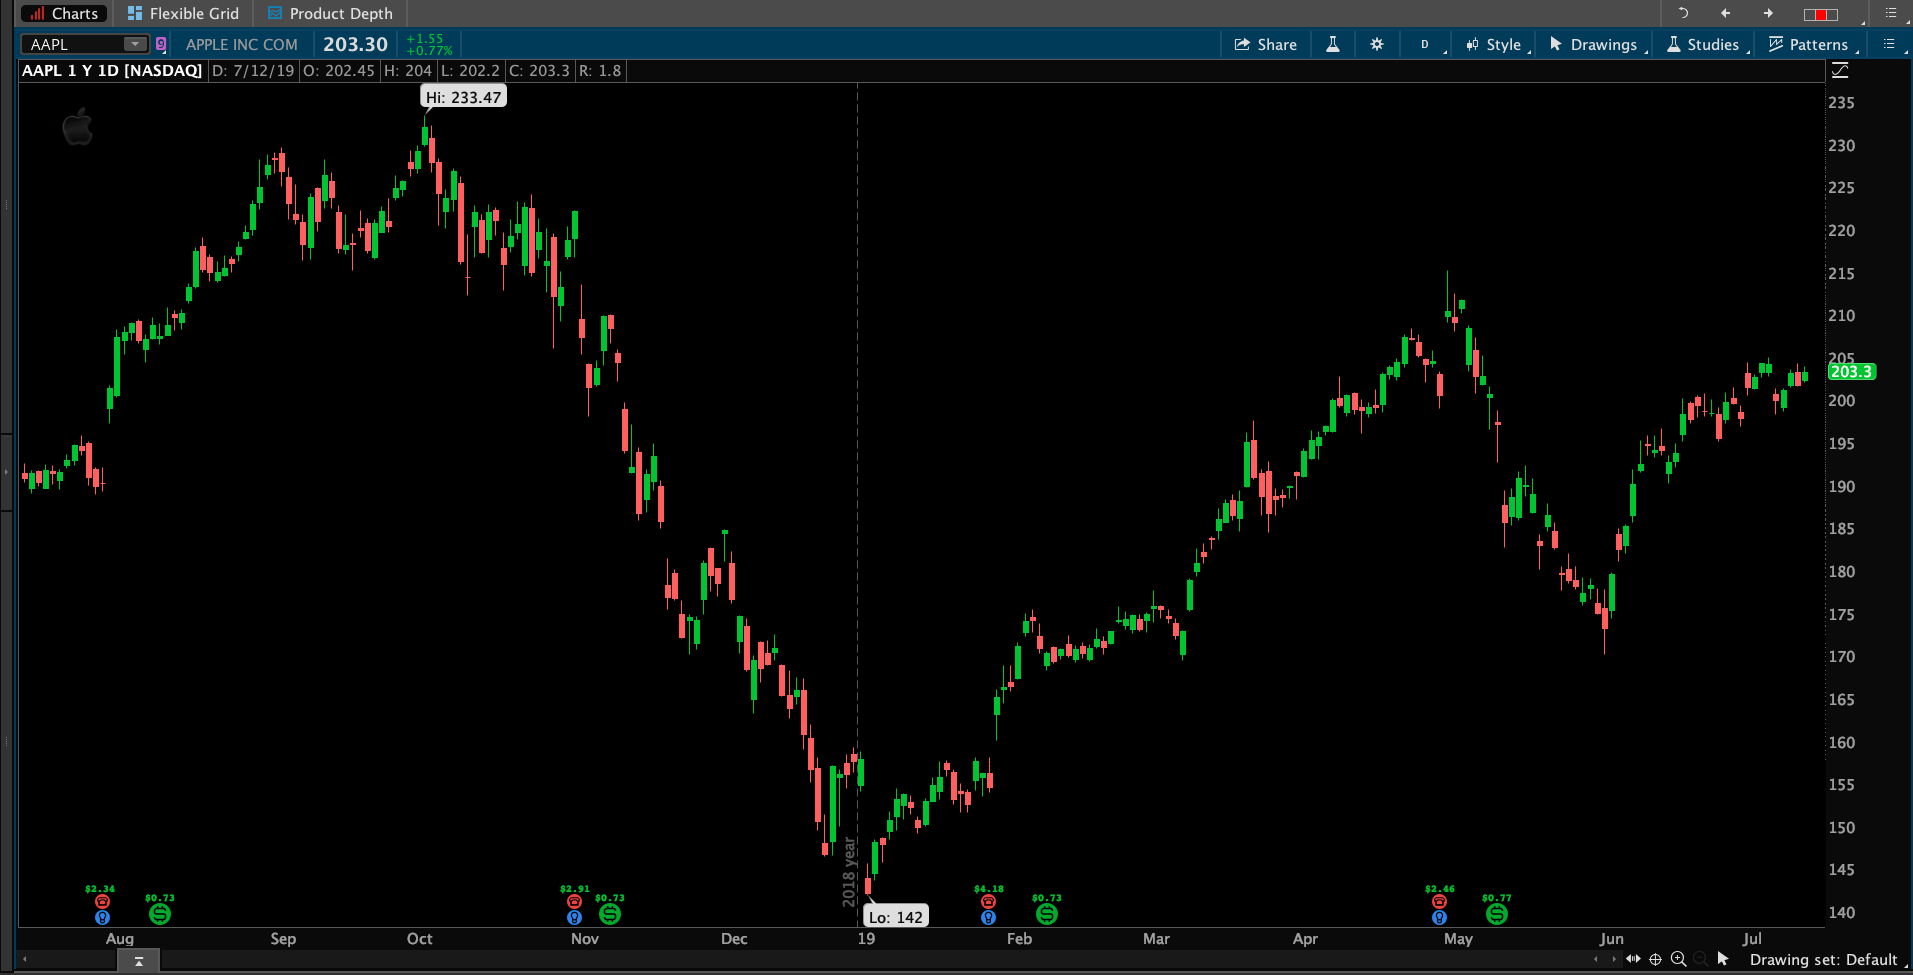
Hi Pete,

Is there a way to mark the chart with an arrow showing the 52-week high?

Thank you.

Marked as spam
Posted by (Questions: 7, Answers: 5)
Asked on July 13, 2019 8:20 am
58 views
0
Private answer

There must be more to this request than what you have described. Because there is absolutely no need for this. You can simply load a daily chart of 1 year worth of data. The highest on the chart is your 52 week high and the lowest on the chart is your 52 week low.

Perhaps you had something else in mind? Screenshot shows the chart I just described.

And if you wanted to display the values at the 52 high and low, you can simply turn on that setting for the chart: "Show high/low bubbles". Second screenshot shows that result.

So what am I missing?

Attachments:
Marked as spam
Posted by (Questions: 37, Answers: 4087)
Answered on July 14, 2019 3:51 pm
0
I didn't realize that the bubble provided the high for the displayed time period. That was an easy answer. Helpful as always, Pete. Thank you.
( at July 15, 2019 3:27 am)