| ♥ 0 |
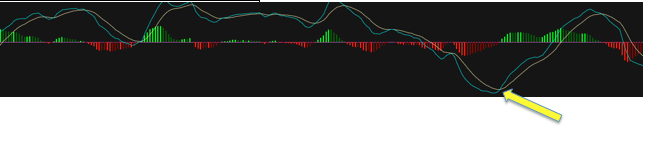
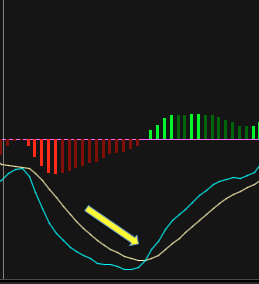
Peter, After following your analysis of the MACD below the zero line crossover from a previous post.I found your response to a question very informative ” Very important to note that MACD does not have true “overbought/oversold” levels. The amount the lines move above or below zero is directly related to price of the underlying instrument. A 5 dollar stock will have a much lower range above and below zero then a 500 dollar stock.” I attached two images of a MACD over a 1 year period and the other of a zoomed in MACD crossover. I would be interested to see if there is code to find these type of crossovers where you can see the fast length below the slow length for a given amount of time and steadily declining where it will then crossover at the lowest point of a given time which in this case was 1 year. Attachments:
Marked as spam
Asked on March 9, 2017 11:55 am
1125 views
|
|
Private answer
I updated the title of this question to better match the context of it’s description. Here is the code to perform the scan as requested. The Inputs:There are two inputs to adjust how the crossover detection is handled. The lookbackPeriod is the length of time the two lines of the MACD should be crossed to the downside. This is the same as the Histogram being below zero line and thus the code uses this instead of testing the two lines. The other input is called barsBeforeCrossover and this tells how many bars before the crossover to look for the lowest price of the Value line. How it Works:The code compares this low to the lowest price of the Value line during the lookbackPeriod. This is a very simplistic approach. It does not detect if the two lines of the MACD had been in a steady decline throughout the lookbackPeriod. The default value of the lookbackPeriod is set to one year of daily bars. I imagine this condition is very rare. The Scan:The final statement at the end is testing for the signal having occurred a number of bars in the past. In this case, it is looking backward to see if the given conditions were present anytime within the last 30 bars. In order to get any signals to show up, I had to set the lookbackPeriod down to 60. Don’t forget to up-vote the answers that best solve your question! Here is the code:
Marked as spam
Answered on March 9, 2017 6:10 pm
|
|||
|
Private answer
Pete, Sorry for the delay I have been traveling. I have been playing around with that code but it is not coming up with anything. In my scans I change the Fast/ Slow length to 15/30. Currently the stock MGM is doing this crossover as you can see from the attachment. For some reason this scan is not picking this up. Do you have any idea what can be changed to find tis. I do realize that this is a rare occurrence but it seems that A stock will usually do this once or twice per year. Attachments:
Marked as spam
Answered on March 15, 2017 8:32 am
|
|||
|
Private answer
Pete, Sorry for not providing the aggregation period. I currently have it set at a Daily Chart. In terms of the histogram moving above the zero line becoming invalid. I would omit that language. As you can see from the MGM screenshot the histogram is above zero on more then one occasion. The anomaly that I find interesting is when the Fast is below the slow and the two of them are in that almost free fall over a period of time then you have that crossover that occurs when it bottoms out. I believe I sent you a PayPal for the premium??? I am not sure if I sent it correctly, please check. Marked as spam
Answered on March 15, 2017 9:43 am
|
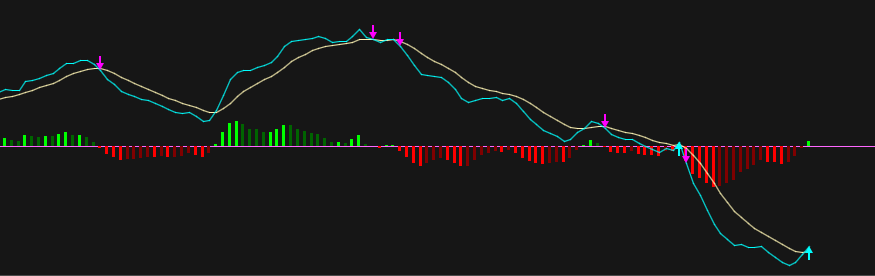
in the screenshot you have provided, it is not possible to see the aggregation period. Is this a daily chart? Also, the scan is looking back 252 bars. If it finds any bars of the histogram moving above the zero line during that period the signal is invalid. This is according to your specifications, as best as I was able interpret them at the time. This screenshot shows at least two points where the histogram turns above zero within the previous 100 or so bars.
After reviewing your original post it appears you may need to have two lookback periods. One to capture the lowest value line in one year. The other to capture the fast line below the slow line ”in a given amount of time”. When I first read your specifications I had interpreted these to be one and the same.
So, other than the one year time span to find the lowest crossover, what is the default time span you want to use for requiring the two lines to be turned downward? Every time they cross back above the counter will reset. Using the example of your screenshot, we can only go back 20-30 bars before the counter would be reset. Which is only about 1/4 of the entire structure, from top to bottom. If you need to capture the entire pattern all the way back to the highest cross below…. that is going to be a premium thinkscript project. The code required to to do that is not something I would publish in the forum.